FalkorDB’s Browser provides a web UI for exploring, querying, and managing FalkorDB graphs. It allows developers to interact with graphs loaded to FalkorDB, explore how specific queries behave, and review the current data model. FalkorDB Browser integrates within the main FalkorDB Docker container and through the Cloud service.
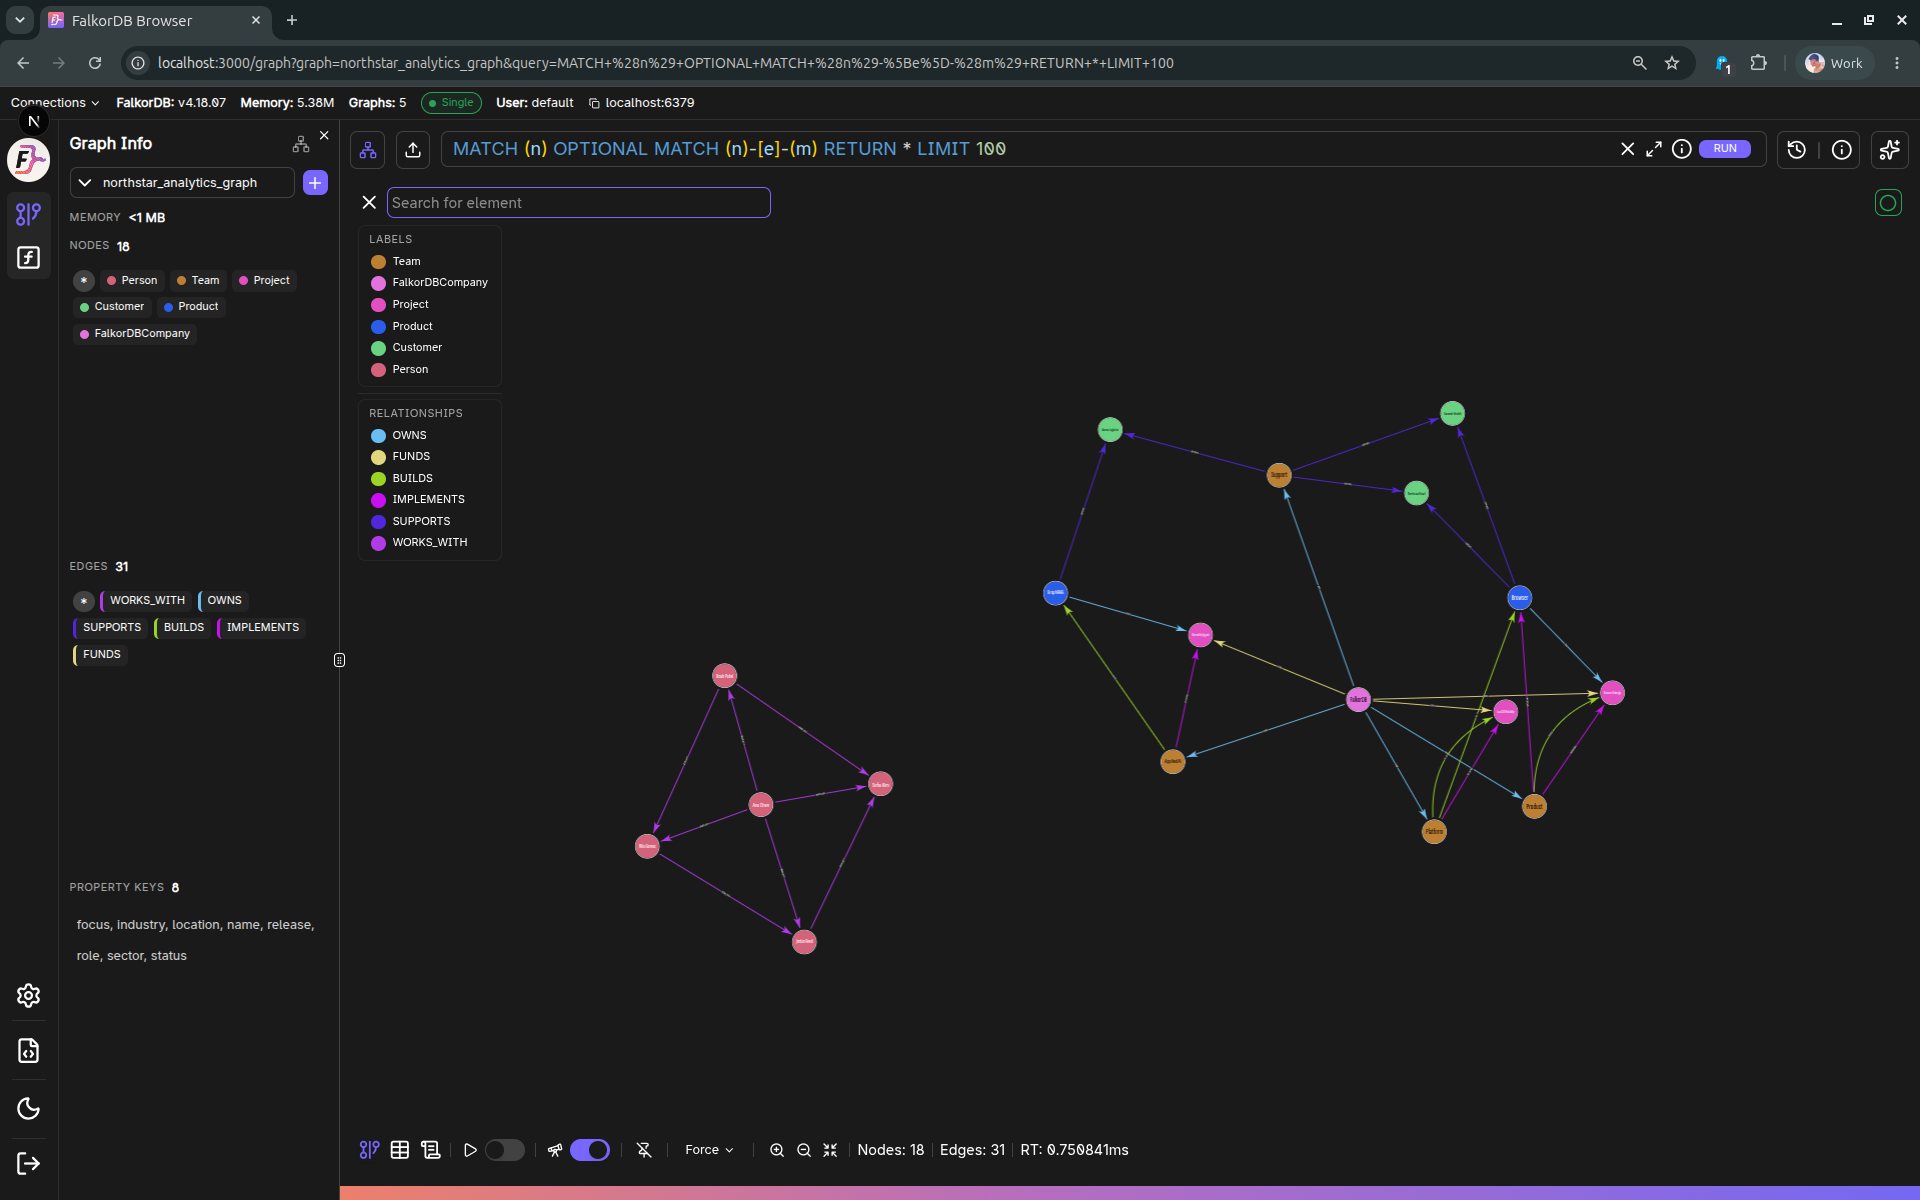
UI elements
For detailed documentation of each major UI element (login, settings, graph canvas, panels, query editor/history, table view, etc.), see:
Visualizes query results containing nodes and edges as an interactive graph. Supports pan, zoom, and interaction with nodes and relationships. Toggles visibility by labels and relationship types.
Element search (in-canvas search)
Search nodes and edges by node properties (string prefix match), IDs, relationship type, and labels.
Data and inspection panel
Selecting an element opens a side panel for inspecting its properties. This panel supports editing workflows (see “Data manipulation”).
Entity Creation Tools
Add a node, an edge, or both to the current graph from the canvas view.
Querying
Feature
Description
Cypher query editor (Monaco)
Includes keyboard shortcuts: Run (Enter and Cmd/Ctrl + Enter) and Insert newline (Shift + Enter). Includes Cypher keyword and function completion.
Results views
Graph view for node and edge results. Table view for tabular results.
Query metadata
The Metadata tab shows query metadata text, explain plan (nested tree), and profile output (nested tree).
Query history
Feature
Description
Persistent query history
Stores in browser localStorage.
History browser dialog
Search and filter previous queries by graph name; supports single or multi-select delete.
Per-query metadata
Review metadata, explain, and profile for past queries.
Data manipulation (nodes/relationships)
Feature
Description
Create and delete operations
Create node and create relationship flows from the Graph UI. Delete elements (node or relationship) from the Graph UI.
Edit labels
Edit labels through API routes (the UI provides label management components).
Create a copy of an existing graph (including data).
Export graphs
Download a .dump file via the Browser (/api/graph/:graph/export).
Upload data
Upload data through the “Upload Data” dialog, which supports drag-and-drop file selection.
Graph Info panel
Feature
Description
Memory Usage tracking
Exposes current memory utilization of the graph in MB.
Node Label tracking
Displays all node labels and controls style visualization. Click a label to trigger a query for those nodes.
Edge Type tracking
Displays all edge types. Click an edge type to trigger a query showing connected nodes.
Property Keys tracking
Displays all property keys. Click a key to see nodes and edges where the property exists.
API Documentation
Feature
Description
Built-in Swagger UI
Available at /docs. Loads the OpenAPI spec from /api/swagger. Supports “Try it out” with X-JWT-Only: true headers.
Authentication & access control
Feature
Description
Authentication
Uses NextAuth (credentials-backed) for authentication.
Role-aware UI capabilities
Read-Only users cannot create graphs. Admins can access DB config and user management.
Settings
Section
Description
Browser settings
Query timeouts, result limits, content persistence (auto-save), and display-text priority for node captions.
DB configurations (Admin)
View and update server configuration values.
Users (Admin)
List users, adjust roles, add or delete users.
Personal Access Tokens
Generate tokens with optional expiration and revocation management.
Common Workflows
Running and visualizing queries
Step
Action
1
Go to Graphs and select a graph.
2
Write a Cypher query in the editor and run it.
3
Inspect results in the Graph tab (canvas) or Table tab (rows).
4
Use Labels and Relationships toggles to focus the canvas.
Inspecting and editing elements
Step
Action
1
Click a node or edge in the canvas.
2
Use the Data panel to inspect properties and apply actions.
Working with query history
Step
Action
1
Open Query History and filter by graph or search text.
2
Select a query and review Metadata, Explain, or Profile.
Exporting graph data
Step
Action
1
Open graph management and select a graph.
2
Click Export Data to download a .dump file.
Frequently Asked Questions
5How do I access FalkorDB Browser?
FalkorDB Browser is a web UI accessible at port 3000 by default. It is included in the main FalkorDB Docker container and is also available through the Cloud service.
What connection URLs does FalkorDB Browser support?
The Browser supports falkor://, falkors://, redis://, and rediss:// URL formats for connecting to a FalkorDB server.
Can I export my graph data from the Browser?
Yes. Navigate to graph management, select a graph, and click Export Data to download a .dump file via the /api/graph/:graph/export endpoint.
What query language does FalkorDB Browser use?
FalkorDB Browser uses Cypher as its query language. The built-in Monaco editor provides keyword autocompletion and syntax highlighting.
Is there an API documentation page built into the Browser?
Yes. A built-in Swagger UI is available at /docs which loads the OpenAPI spec from /api/swagger and supports interactive ‘Try it out’ requests.