

/graph) is the primary workspace for querying and visualizing data.
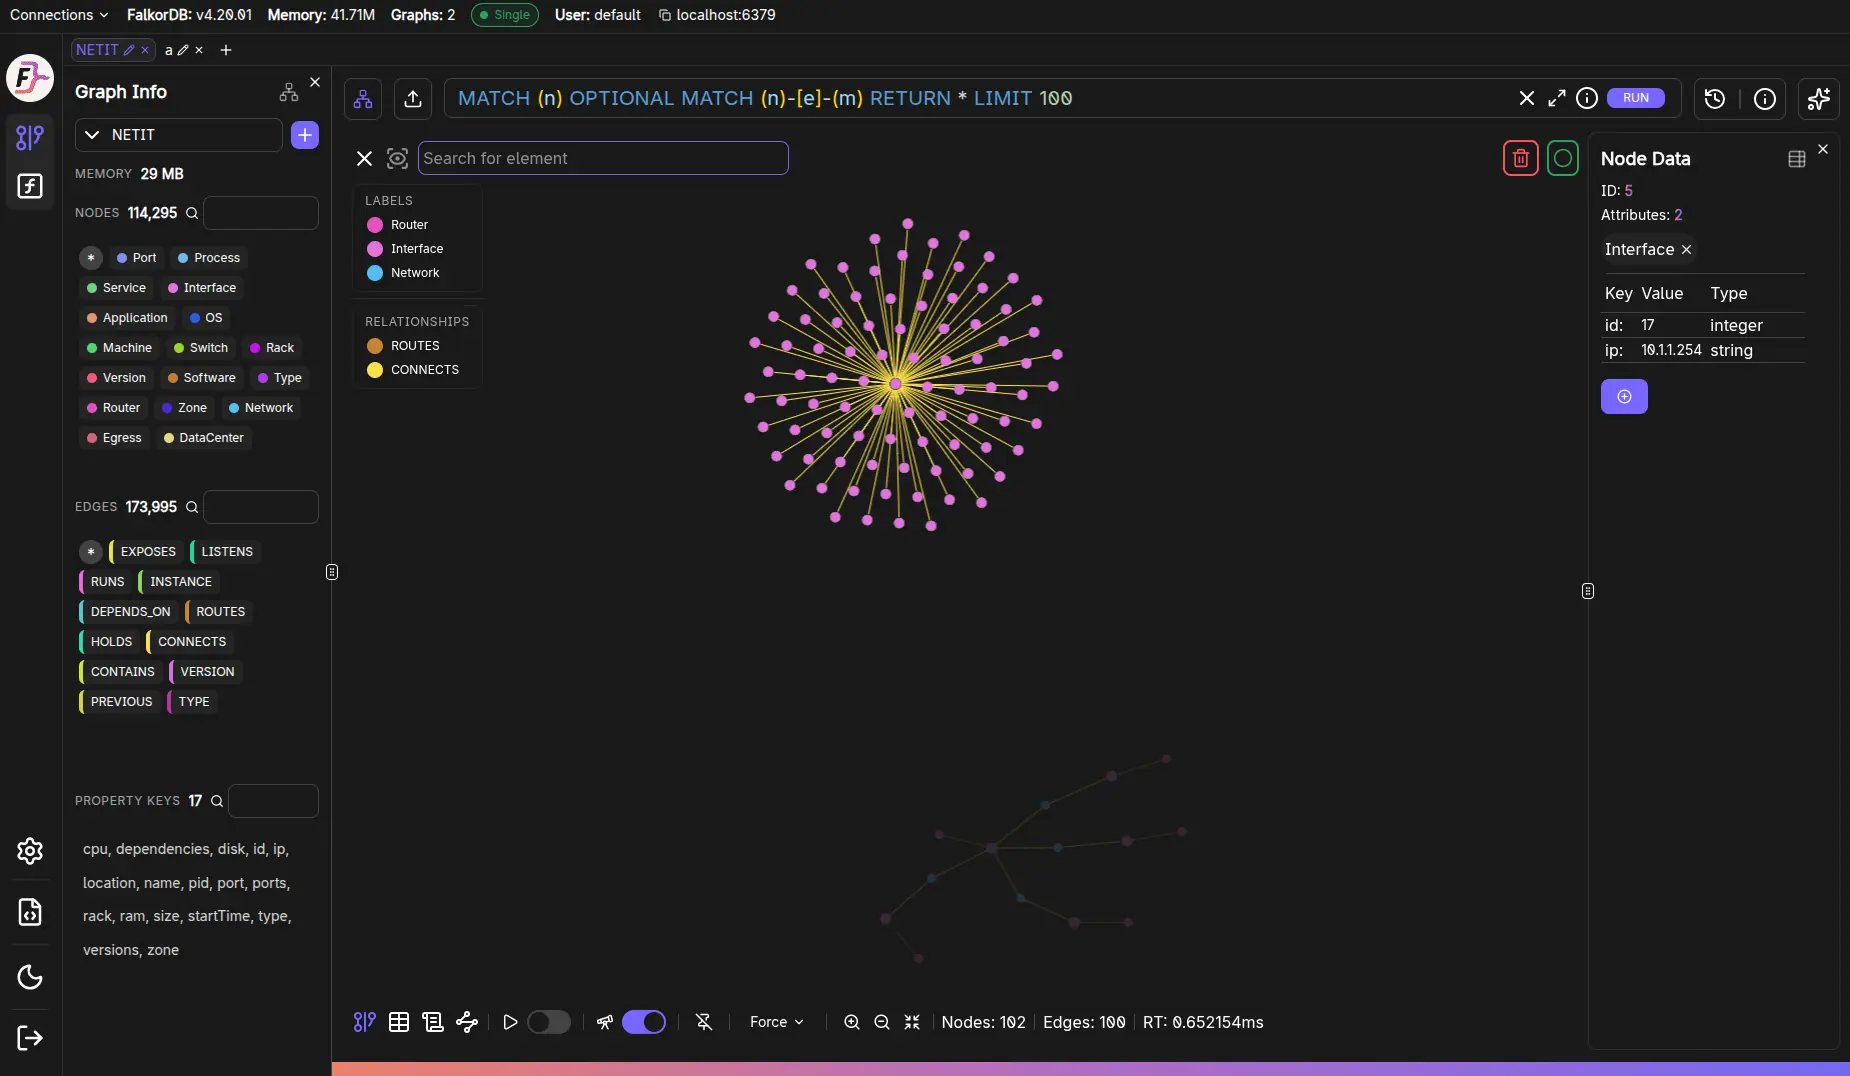
High-level layout
The page is composed of:- Left sidebar (navigation, theme, graph info/chat toggles)
- Top selector bar
- Graph selector (choose the active graph)
- Query editor (Monaco-based) with Run button
- Query history button + editor maximize button
- Tab strip (one tab per open graph/query; see Graph tabs)
- Main results area
- Graph tab (visual canvas)
- Table tab (tabular results)
- Metadata tab (Explain/Profile/Metadata)
- Schema tab (the graph’s data model; see Schema view)
- Right side panel (can be resized, context-driven)
- Data panel (inspect/edit selected node/edge)
- Add panel (create nodes/edges)
- Chat panel (natural-language querying)
- Graph Info panel and the Customize Style panel
Working in several tabs
The tab strip spans the full width of the page, above the results area. Each tab keeps its own graph, query, results view, canvas position, selection, and panel state, so you can compare graphs or queries side by side. See Graph tabs.Right-hand panel resize behavior
The right panel expands/collapses based on what you’re doing:- Selecting a node/edge typically opens Data.
- Starting “Add node / Add edge” opens Add.
- Toggling Chat opens Chat and clears selection.
Graph info refresh
Graph info (labels, relationship types, property keys, memory usage) is periodically refreshed based on the configured refresh interval.Frequently Asked Questions
How is the Graph page laid out?
How is the Graph page laid out?
The page has a left sidebar for navigation, a top selector bar with the graph selector and query editor, a main results area with Graph/Table/Metadata tabs, and a right side panel for data inspection, adding elements, or chat.
Can I resize the right side panel?
Can I resize the right side panel?
Yes. The right panel expands and collapses based on context (selecting an element opens Data, creating elements opens Add, toggling Chat opens the Chat panel) and can be manually resized.
How often does Graph Info refresh?
How often does Graph Info refresh?
Graph Info refreshes periodically based on the refresh interval configured in Settings → Browser Settings → Graph Info.
What are the tabs in the results area?
What are the tabs in the results area?
The results area has four tabs: Graph (visual canvas), Table (tabular rows/columns), Metadata (Explain/Profile/Metadata output), and Schema (the graph’s labels, relationship placements, property keys, constraints, and indexes).
Can I keep more than one graph or query open?
Can I keep more than one graph or query open?
Yes. The tab strip above the results area holds several tabs, each with its own graph, query, view, canvas position, and panels. See Graph tabs.