

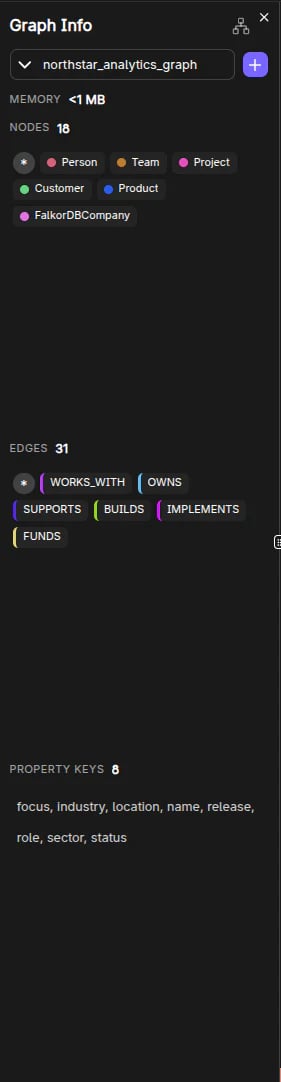
What it shows
- Graph name
- Memory usage (optional; can be toggled via settings)
- Node count and edge count
- Node labels
- Edge (relationship) types
- Property keys
Click-to-explore behavior
The panel is designed for exploration:- Clicking a label runs
MATCH (n:Label) RETURN n. - Clicking an edge type runs
MATCH p=()-[:TYPE]-() RETURN p. - Clicking a property key runs a query that finds nodes/edges where that key exists.
- All nodes (
MATCH (n) RETURN n) - All edges (
MATCH p=()-[]-() RETURN p)
Style customization entrypoint
Next to each label and each relationship type, a palette button opens the Customize Style panel for that label or type.Offloaded graphs (Enterprise)
When a graph has been offloaded from memory, its counts and memory usage are shown asN/A. Reading them would load the graph back into memory, which would
undo the offload. See Graphs Manager for the
loaded/offloaded indicator.
Frequently Asked Questions
How do I explore nodes of a specific label?
How do I explore nodes of a specific label?
Click a label name in the Graph Info panel. This automatically runs
MATCH (n:Label) RETURN n and displays the results on the canvas.Can I see all edges of a specific relationship type?
Can I see all edges of a specific relationship type?
Yes. Click an edge type in the Graph Info panel to run
MATCH p=()-[:TYPE]-() RETURN p and visualize all relationships of that type.What does the memory usage indicator show?
What does the memory usage indicator show?
It shows the current memory utilization of the selected graph in MB. This can be toggled on/off in Browser Settings.
How do I change the visual style of a label?
How do I change the visual style of a label?
Click the palette icon next to a label or a relationship type in the Graph Info panel to open the Customize Style panel, where you can change its color and size.
Why does my graph show N/A for counts and memory?
Why does my graph show N/A for counts and memory?
The graph is offloaded from memory (FalkorDB Enterprise). Reading its statistics would load it back into memory, so the Browser reports
N/A instead.