

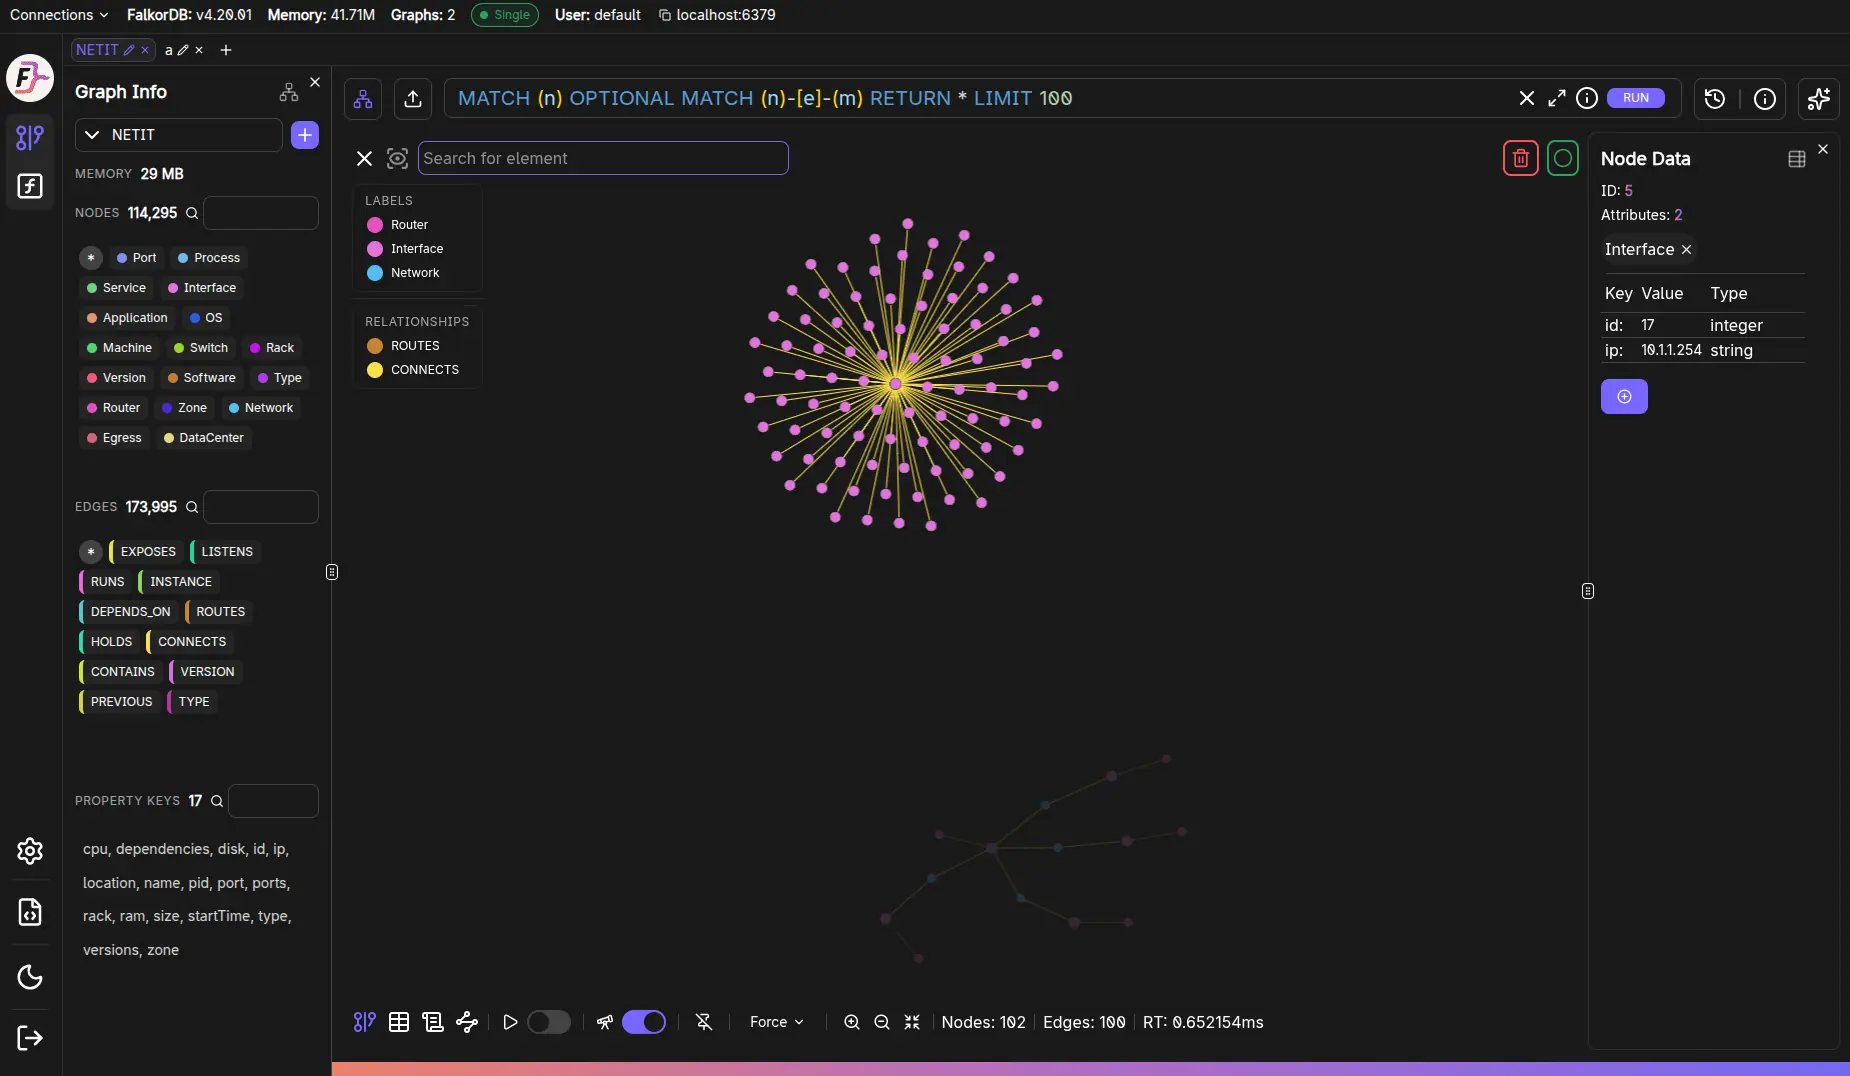
Core interactions
- Pan/zoom the canvas to explore results.
- Select nodes/edges to inspect them (opens the Data panel).
- Right-click / context menu is used in the tutorial flow to open element details.
Labels & Relationships filters
When you have results, the overlay includes:- Labels list: toggle visibility of nodes by label.
- Relationships list: toggle visibility of edges by relationship type.
Canvas controls
The controls area includes:
All of these are remembered per graph tab, and the
Graph and Schema tabs keep their own settings.
Tabs around the canvas
From the same results region you can switch to:- Table view (when tabular data exists)
- Metadata view (when metadata/explain exists)
- Schema view (the graph’s data model — see Schema view)
Frequently Asked Questions
How do I pan and zoom the graph canvas?
How do I pan and zoom the graph canvas?
Use your mouse or trackpad to pan (click and drag the background) and zoom (scroll wheel or pinch gesture). You can also use the zoom in/out buttons in the canvas controls.
Can I hide certain node labels or relationship types?
Can I hide certain node labels or relationship types?
Yes. Use the Labels and Relationships filter lists overlaid on the canvas to toggle visibility of specific node labels or edge types without re-running the query.
How do I center the graph on screen?
How do I center the graph on screen?
Click the Fit graph to screen button in the canvas controls area to automatically fit all visible elements within the viewport.
What does the animation control do?
What does the animation control do?
The play/pause button controls the force-layout animation which arranges nodes dynamically. Pausing it freezes the layout in its current position.
Can I arrange the graph as a tree?
Can I arrange the graph as a tree?
Yes. Use the Layout control to pick
Tree or Radial, then set the Direction (Top → Down, Bottom → Up, Left → Right, Right → Left, or Outward/Inward). Hierarchical layouts pin nodes automatically.Do canvas settings carry over between tabs?
Do canvas settings carry over between tabs?
No. Layout, direction, animation, pin, dim, and the viewport are stored per graph tab, and the Graph and Schema views keep separate settings within the same tab.