

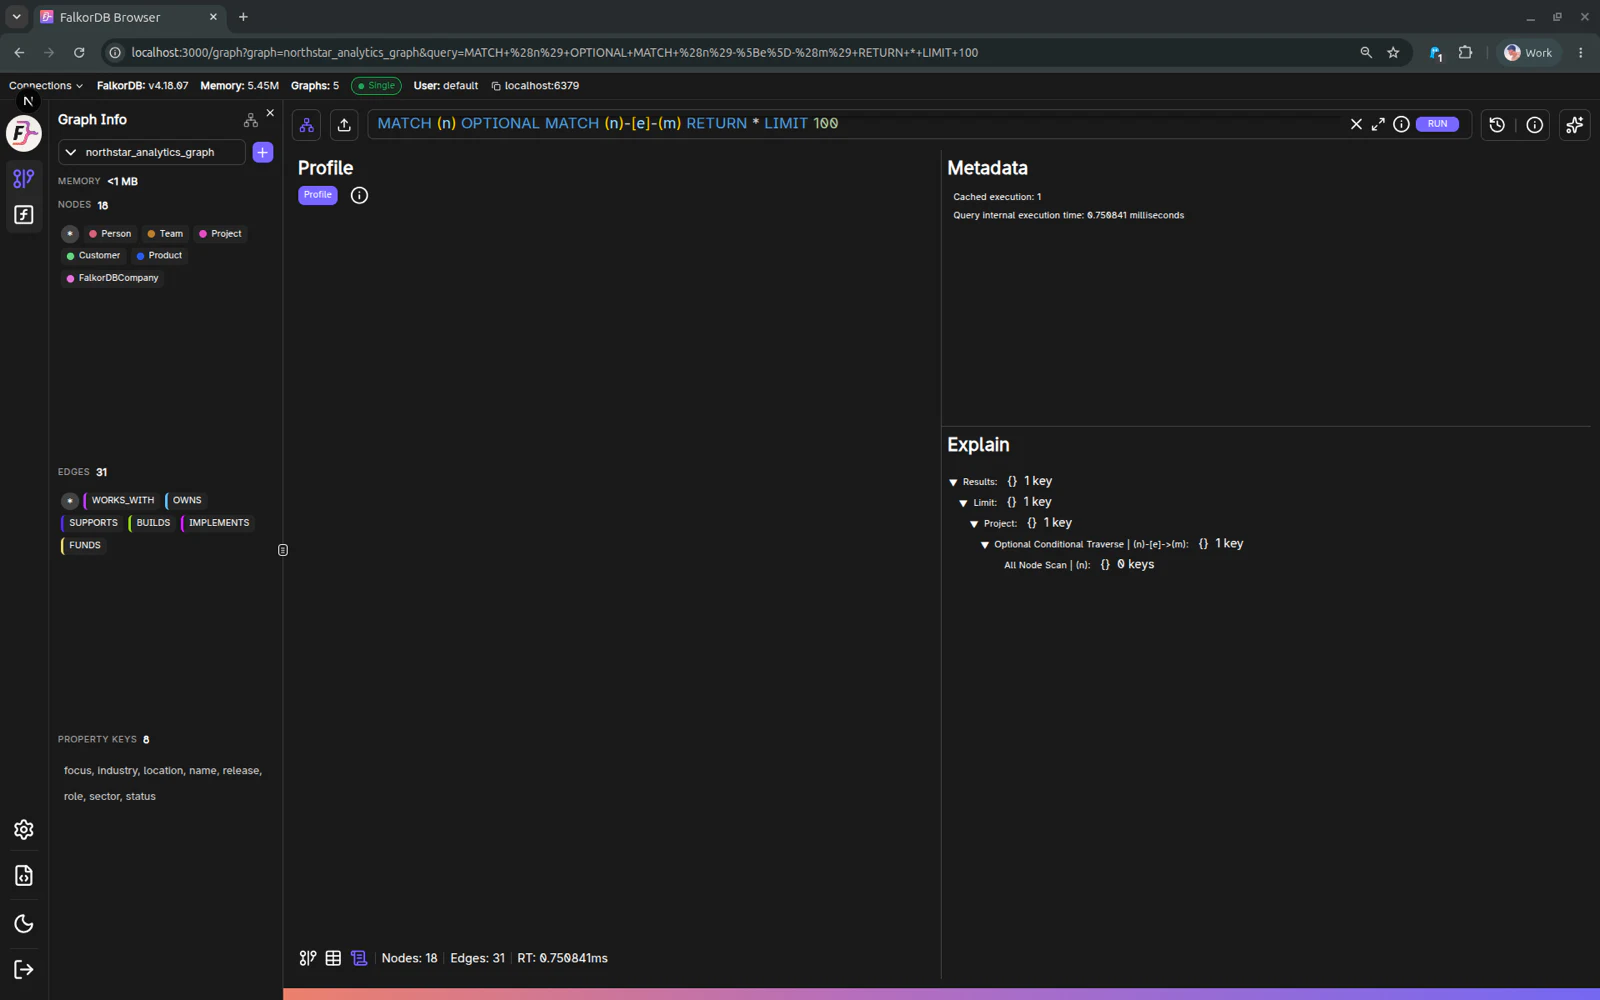
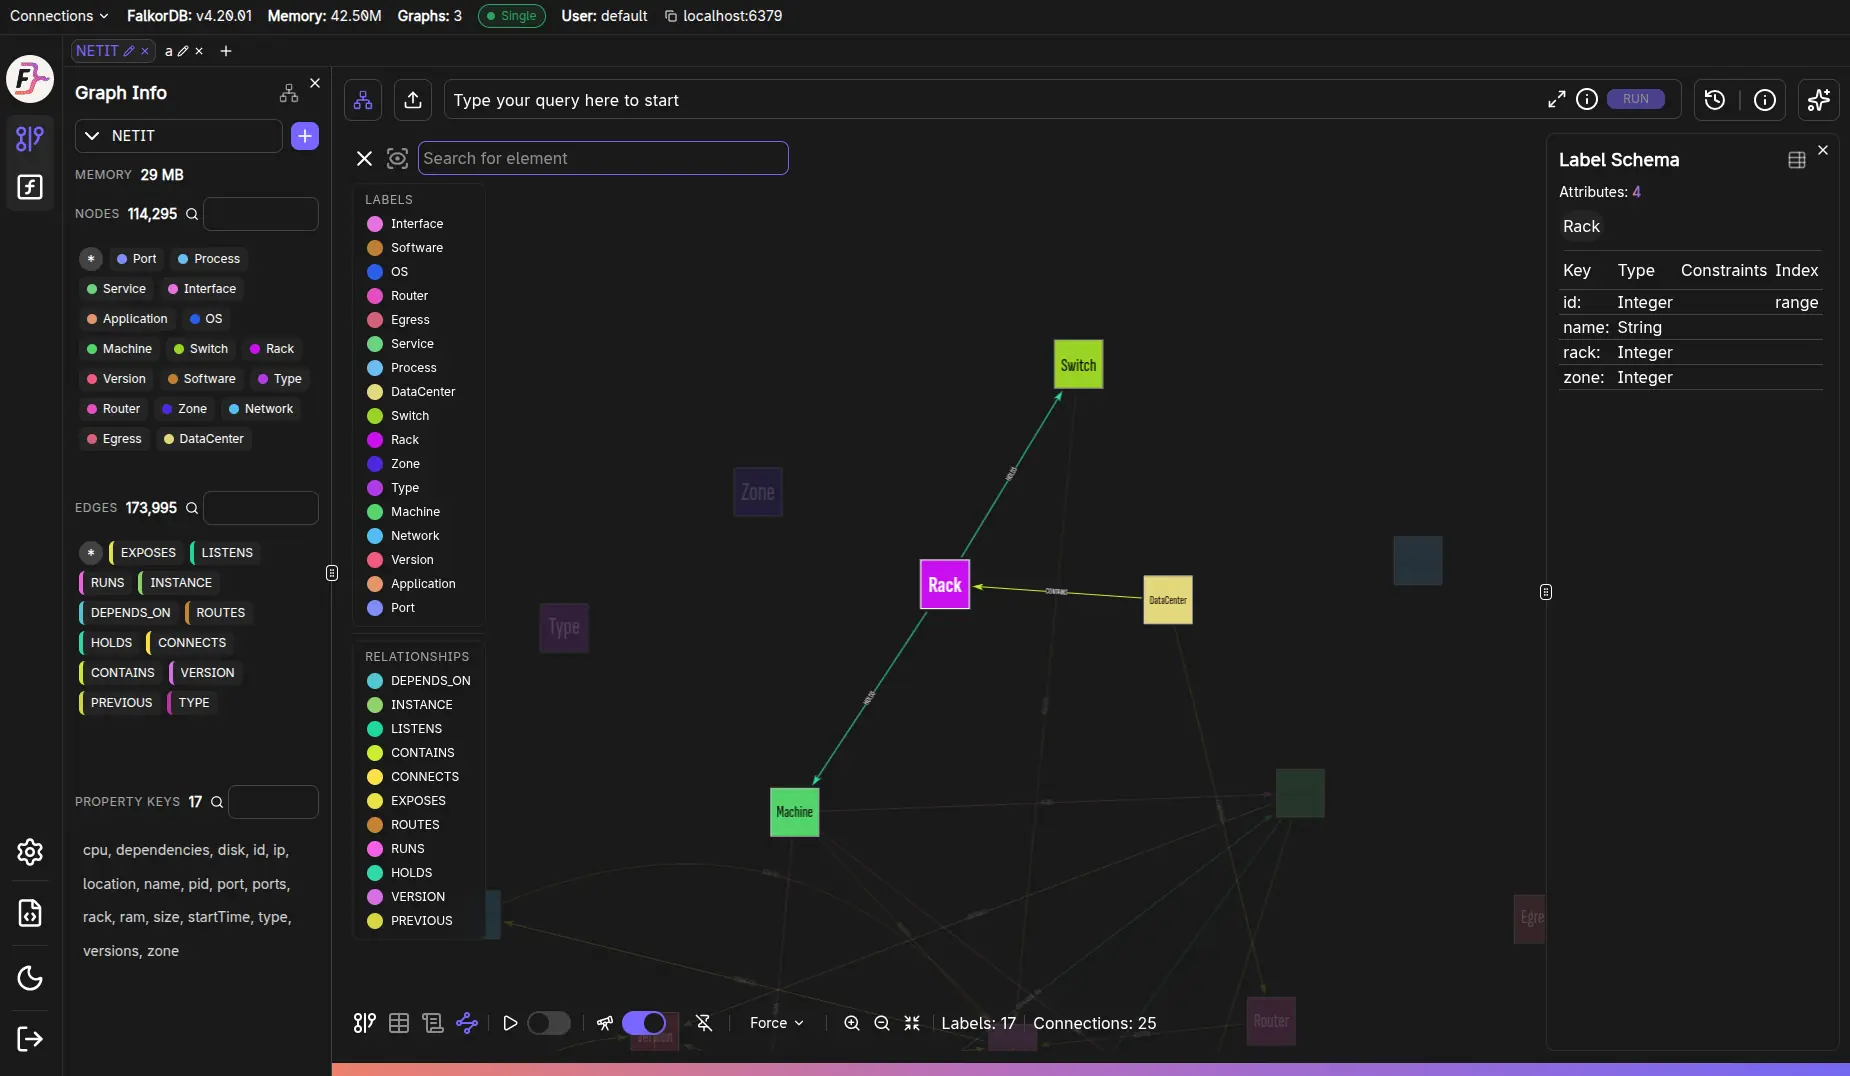
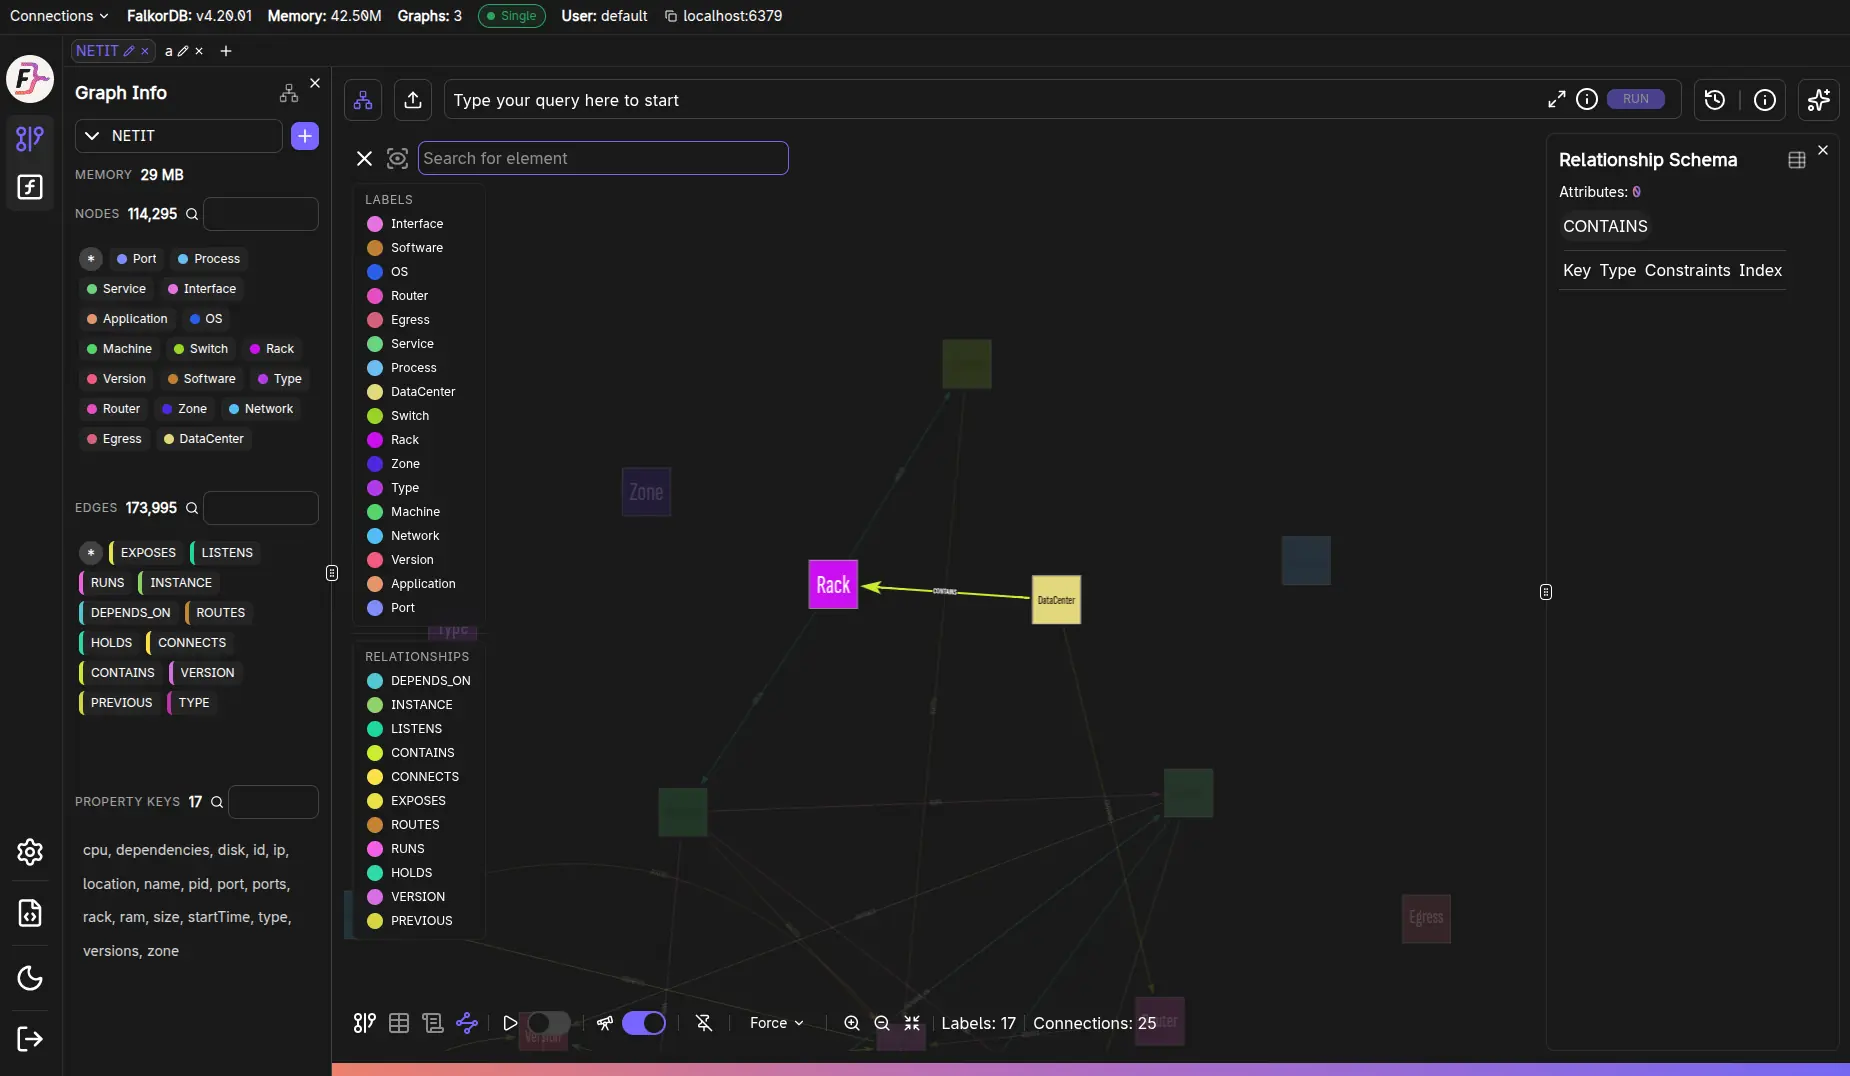
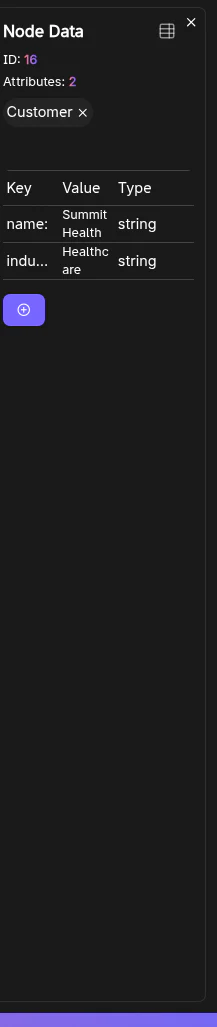
Screenshot set
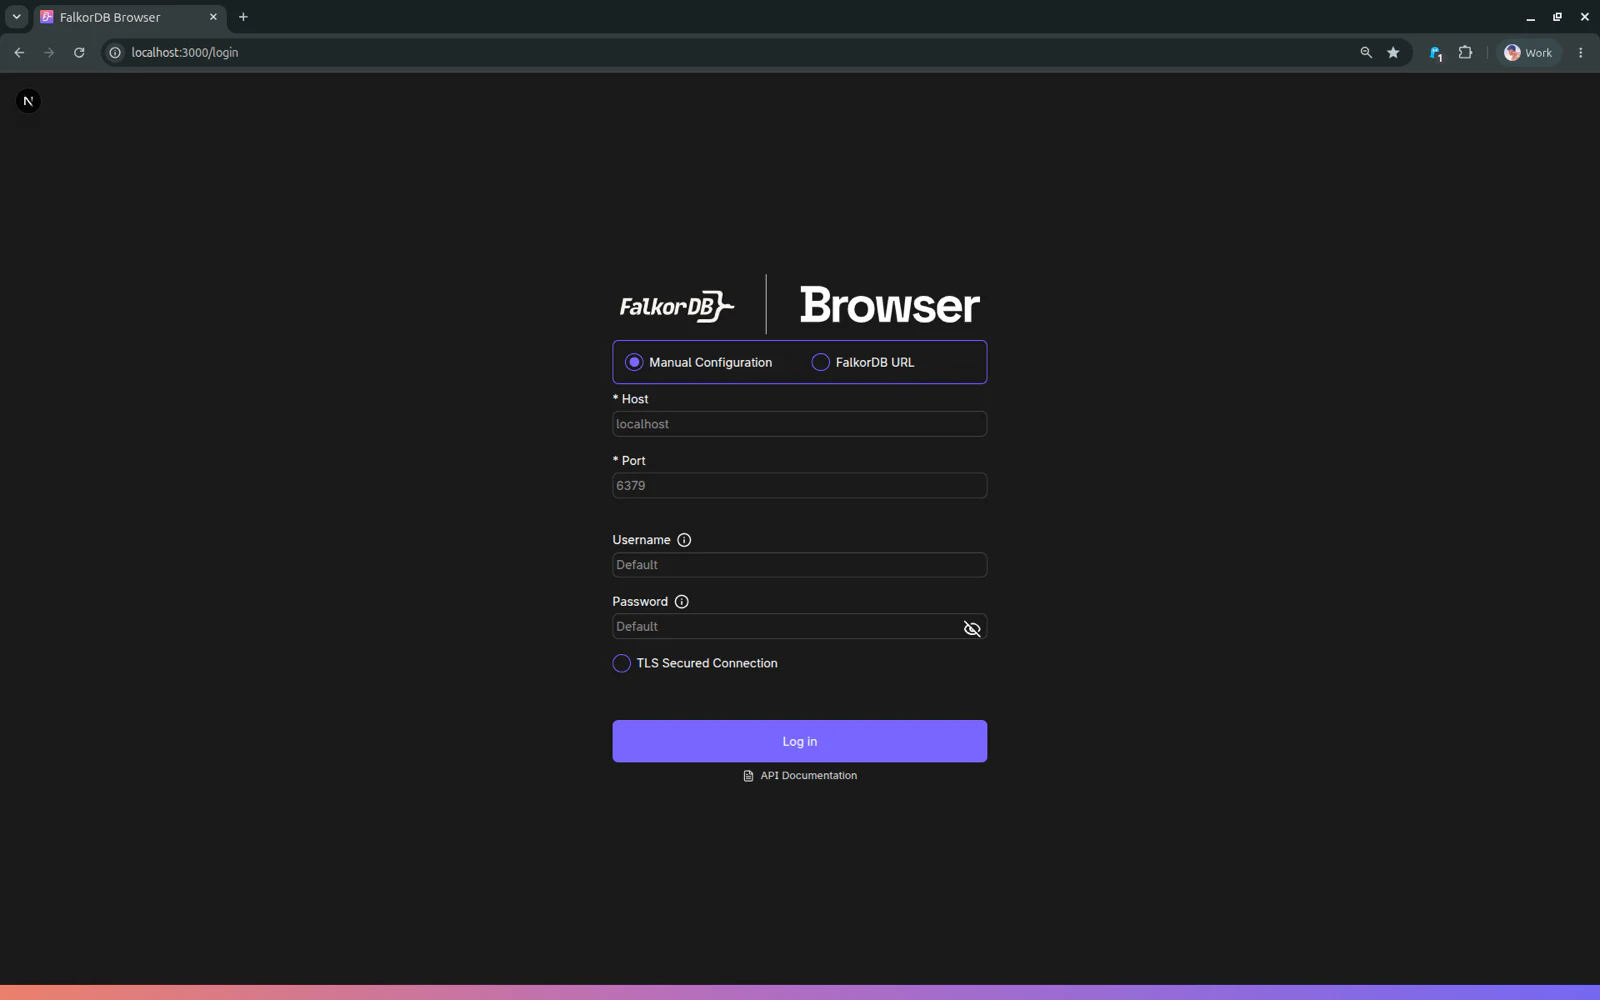
- Login screen
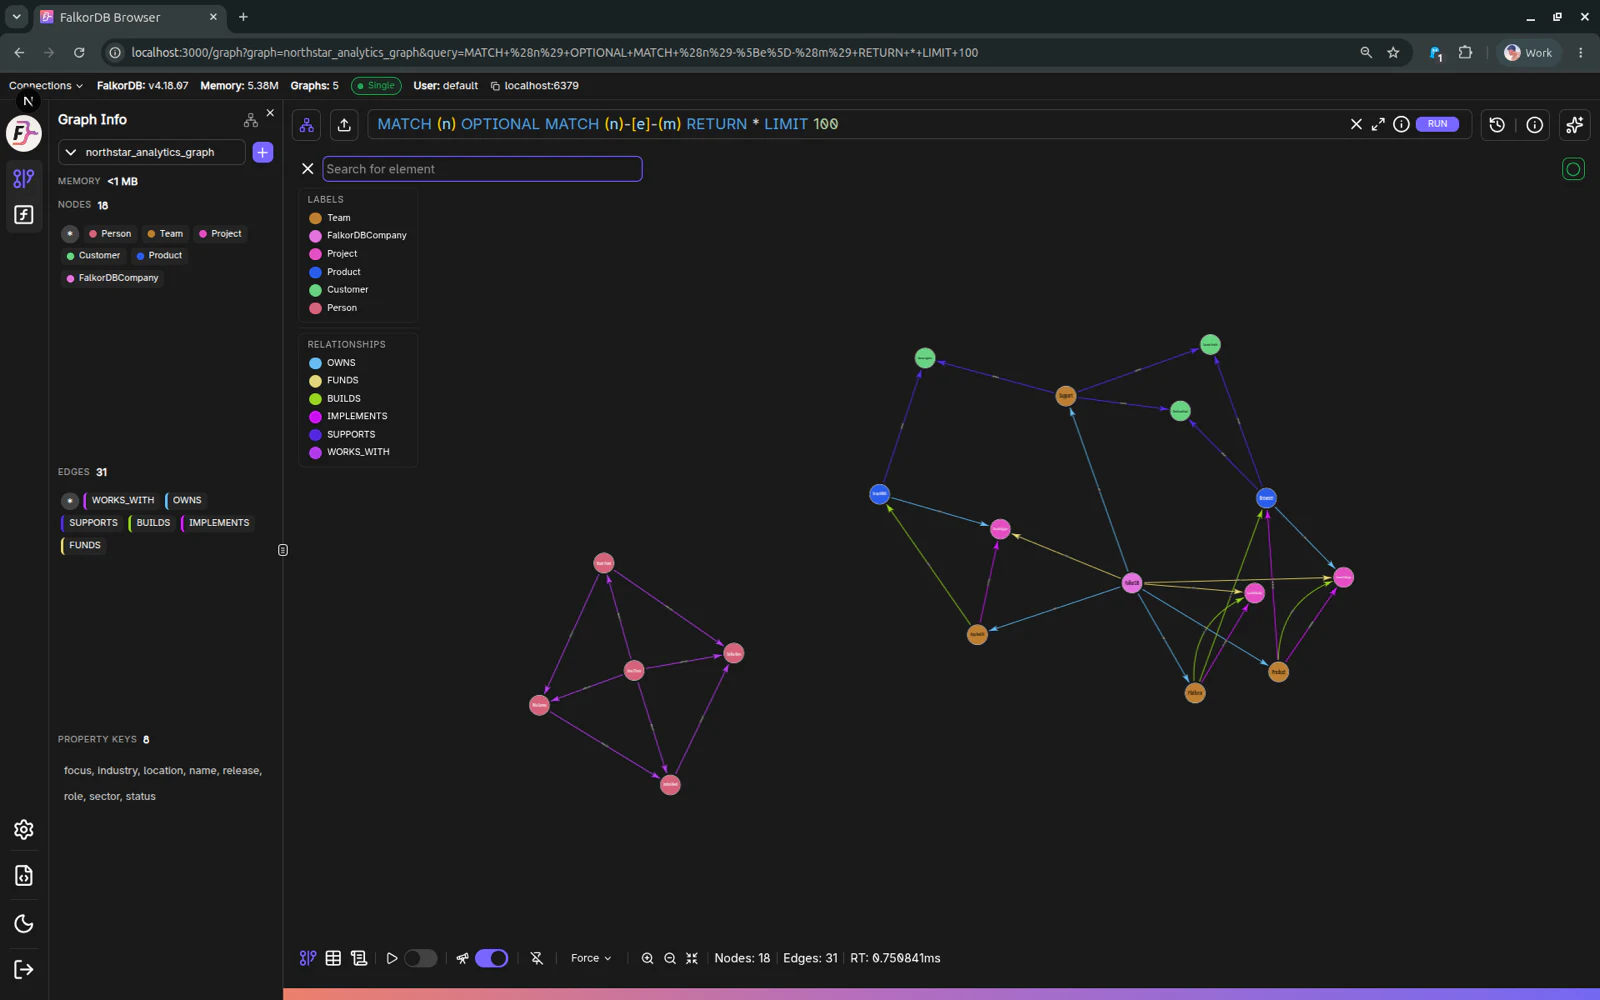
- Main graph overview
- Graph tab strip
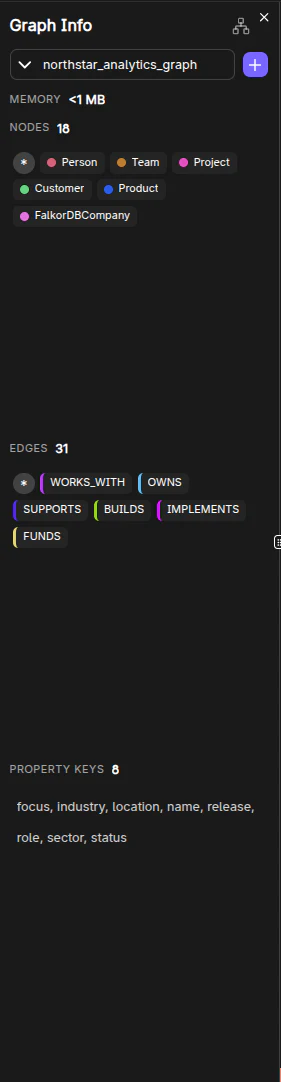
- Graph info panel
- Query editor
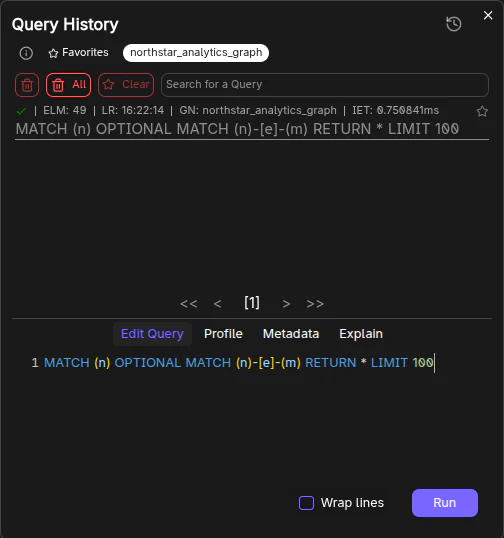
- Query history
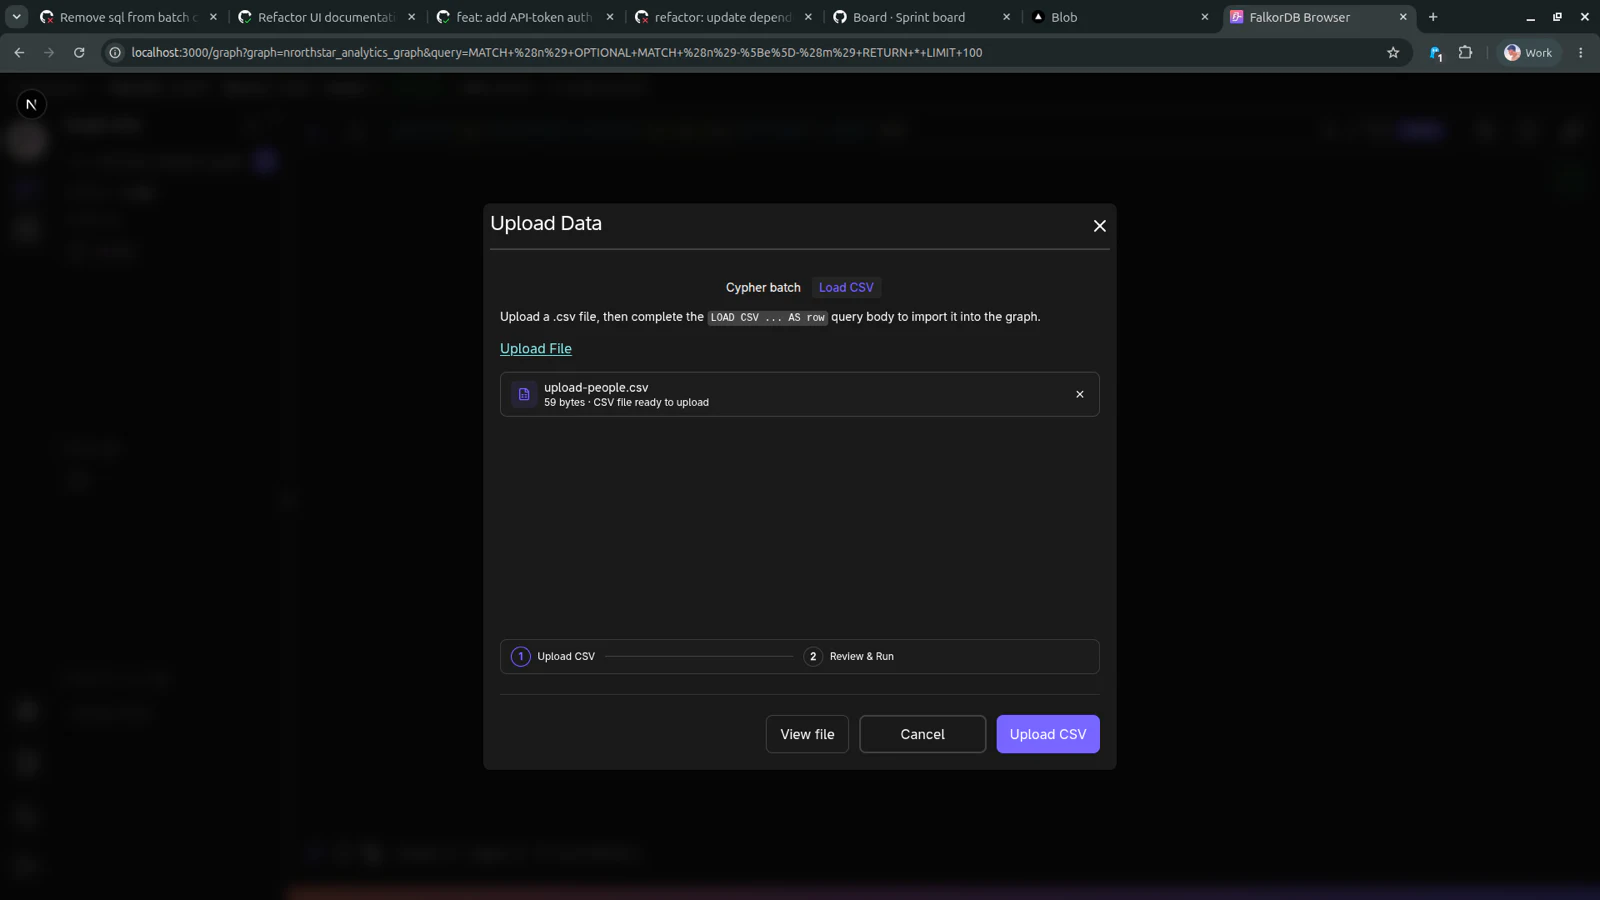
- Upload Data (Load CSV - step 1)
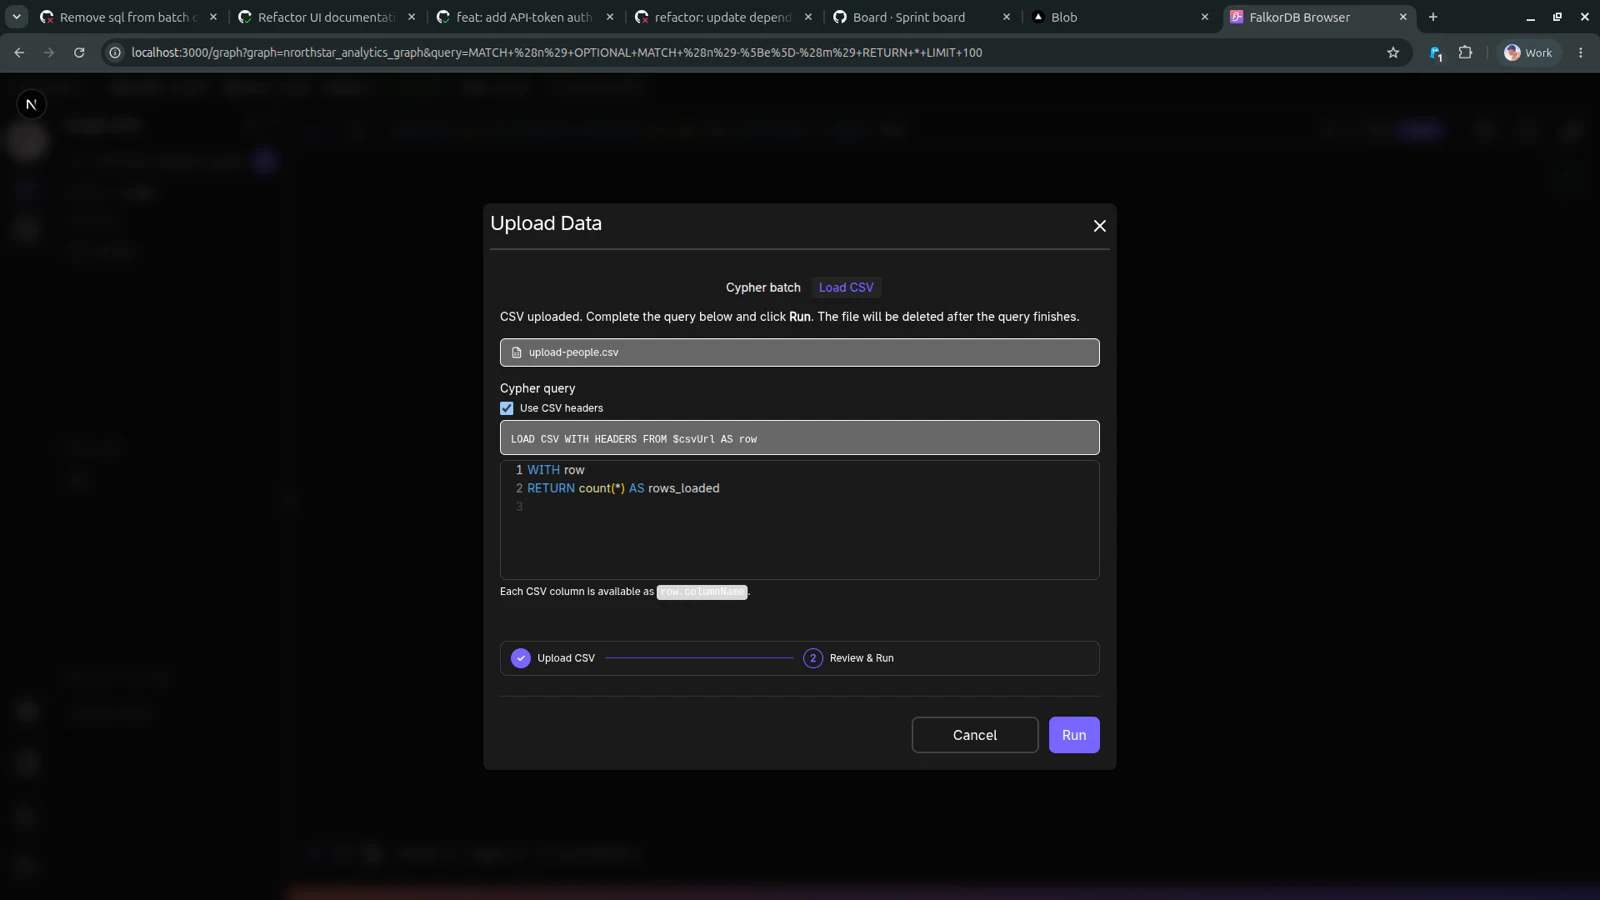
- Upload Data (Load CSV - step 2)
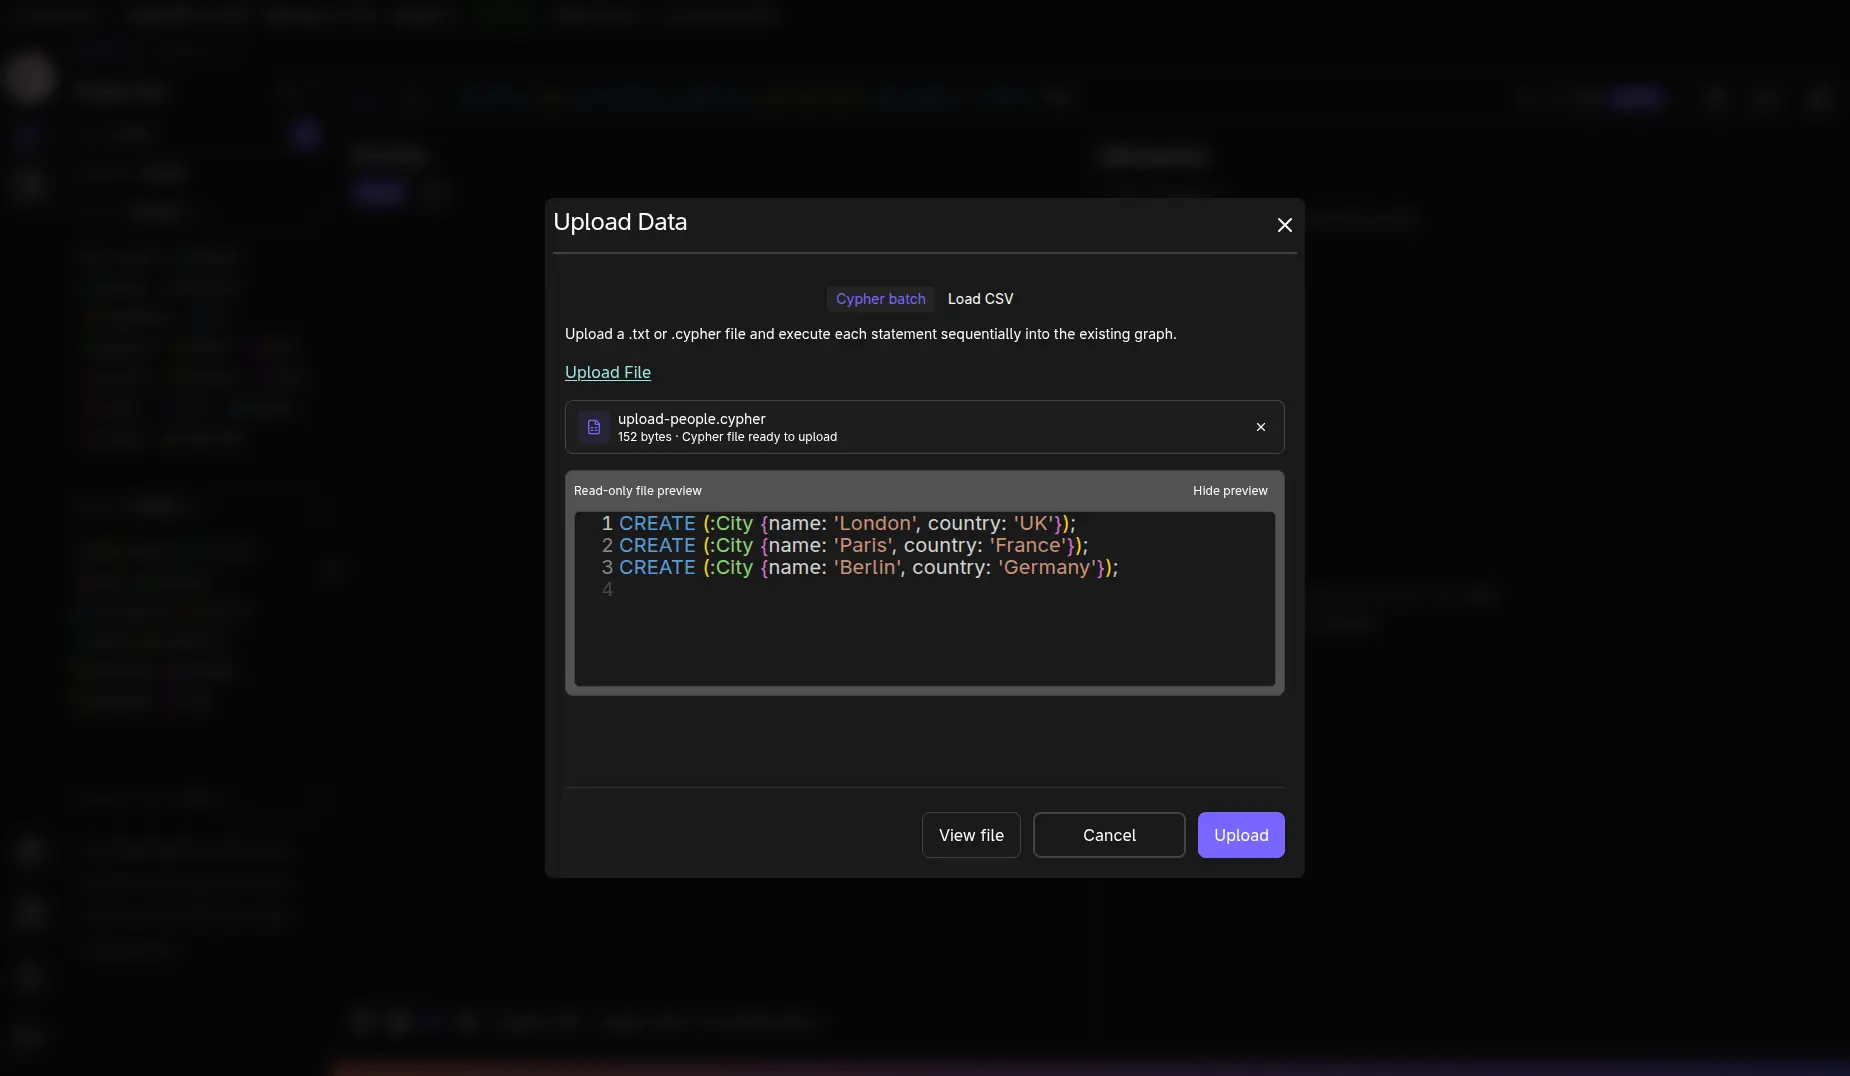
- Upload Data (Cypher batch)
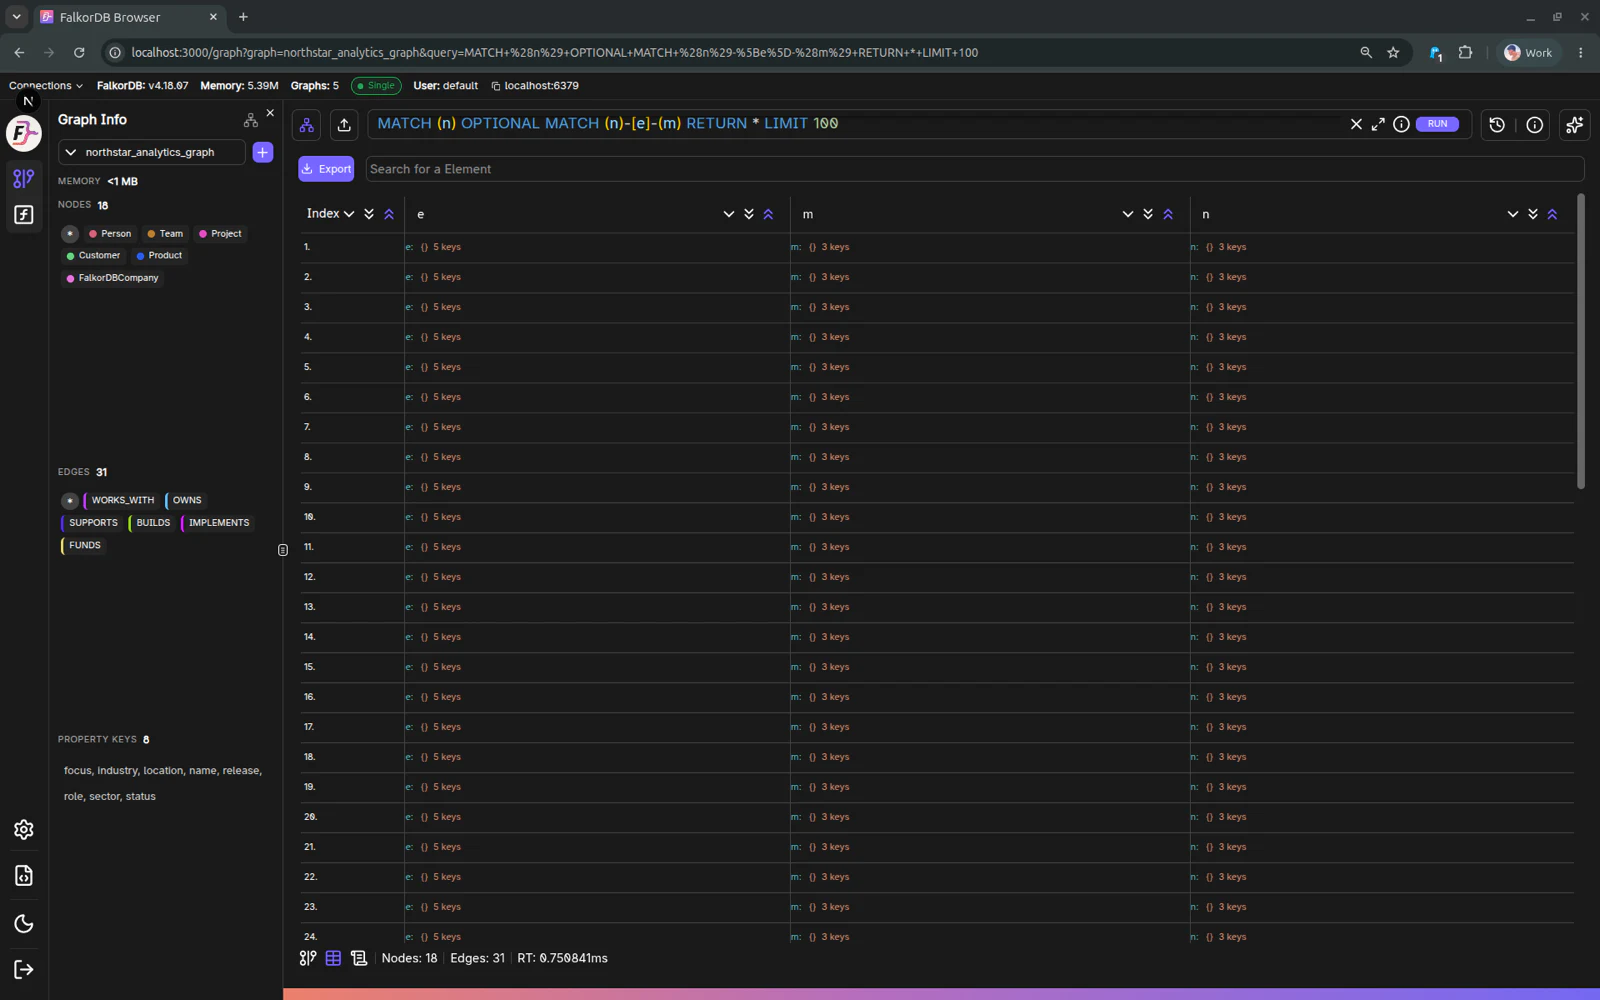
- Table view
- Metadata view
- Schema view (label selected)
- Schema view (placement selected)
- Data / property panel
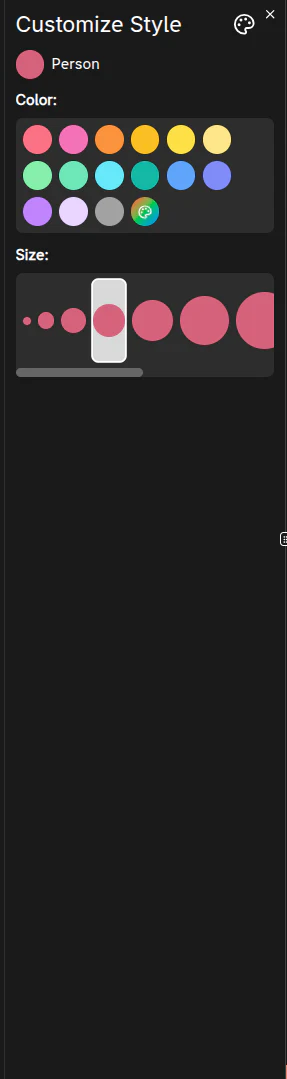
- Customize Style panel
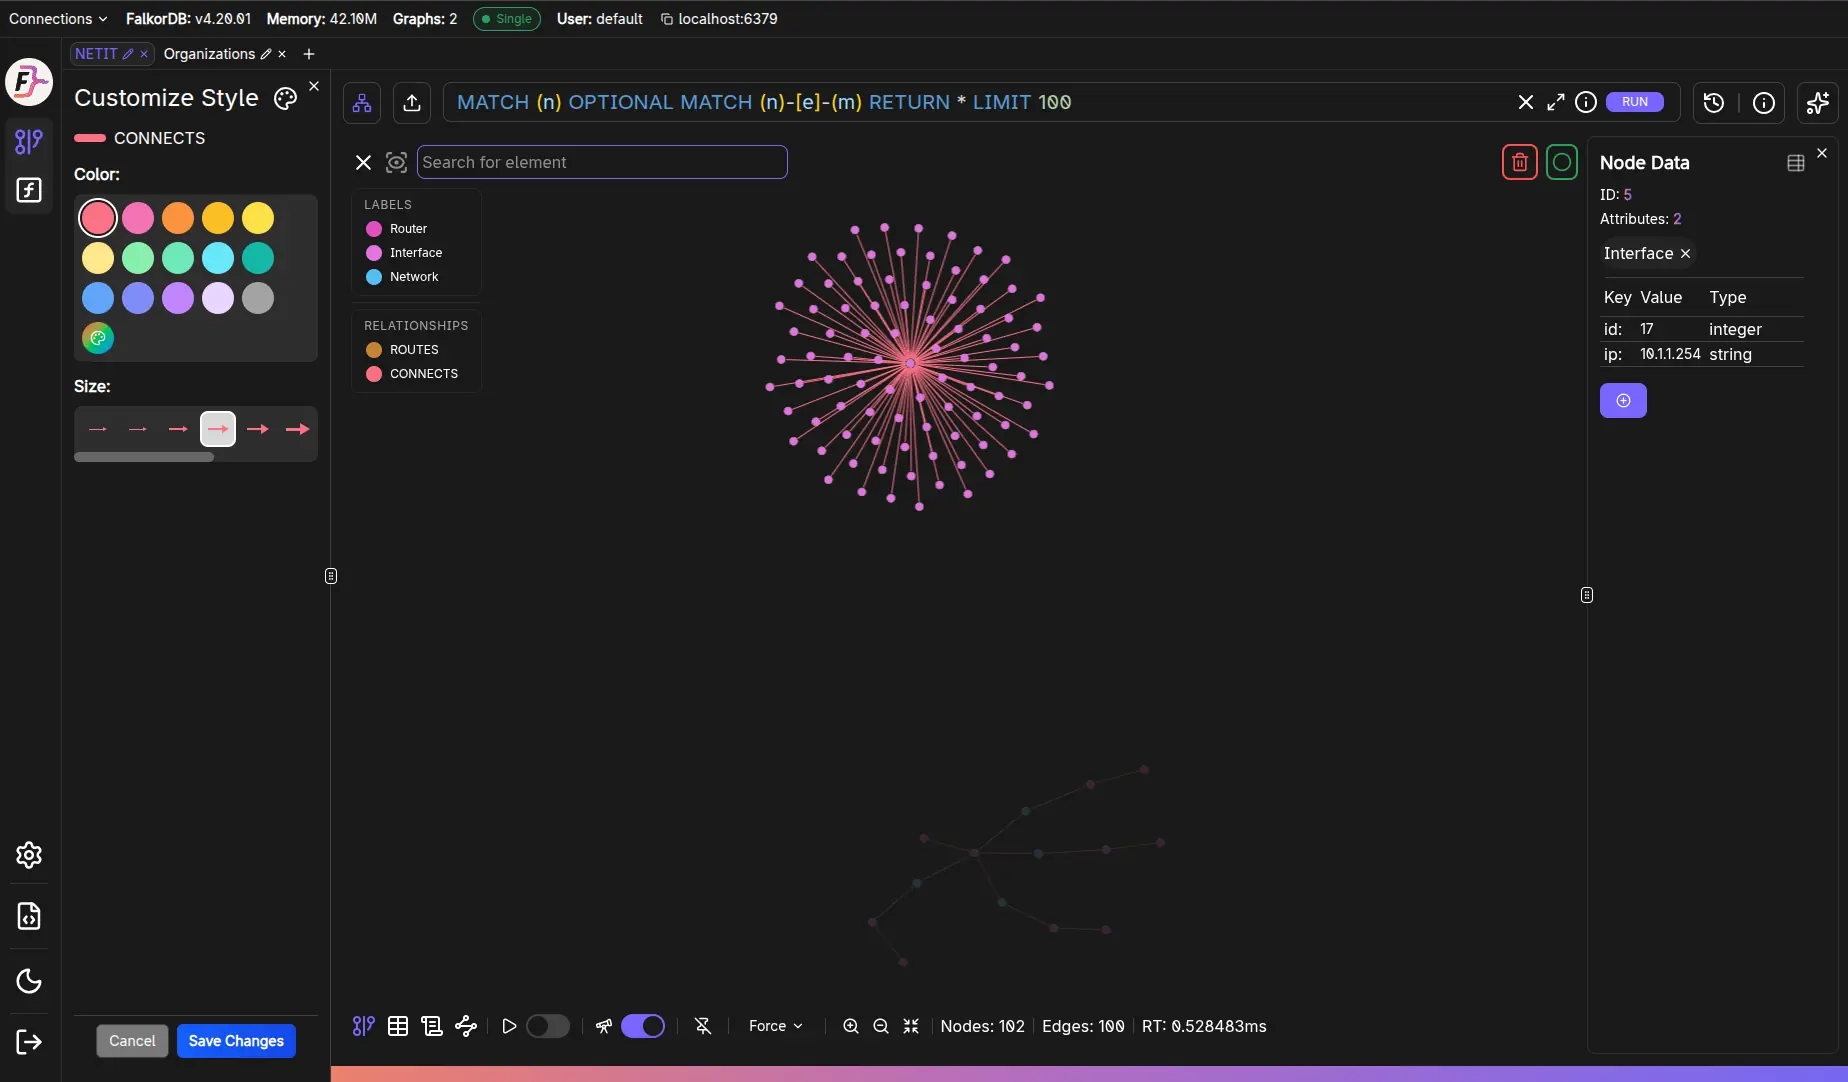
- Customize Style panel (relationship type)
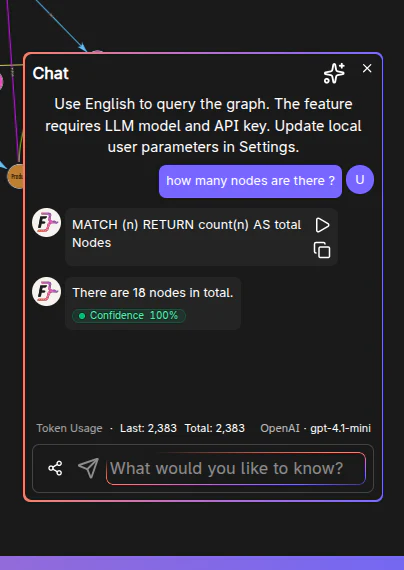
- Chat panel
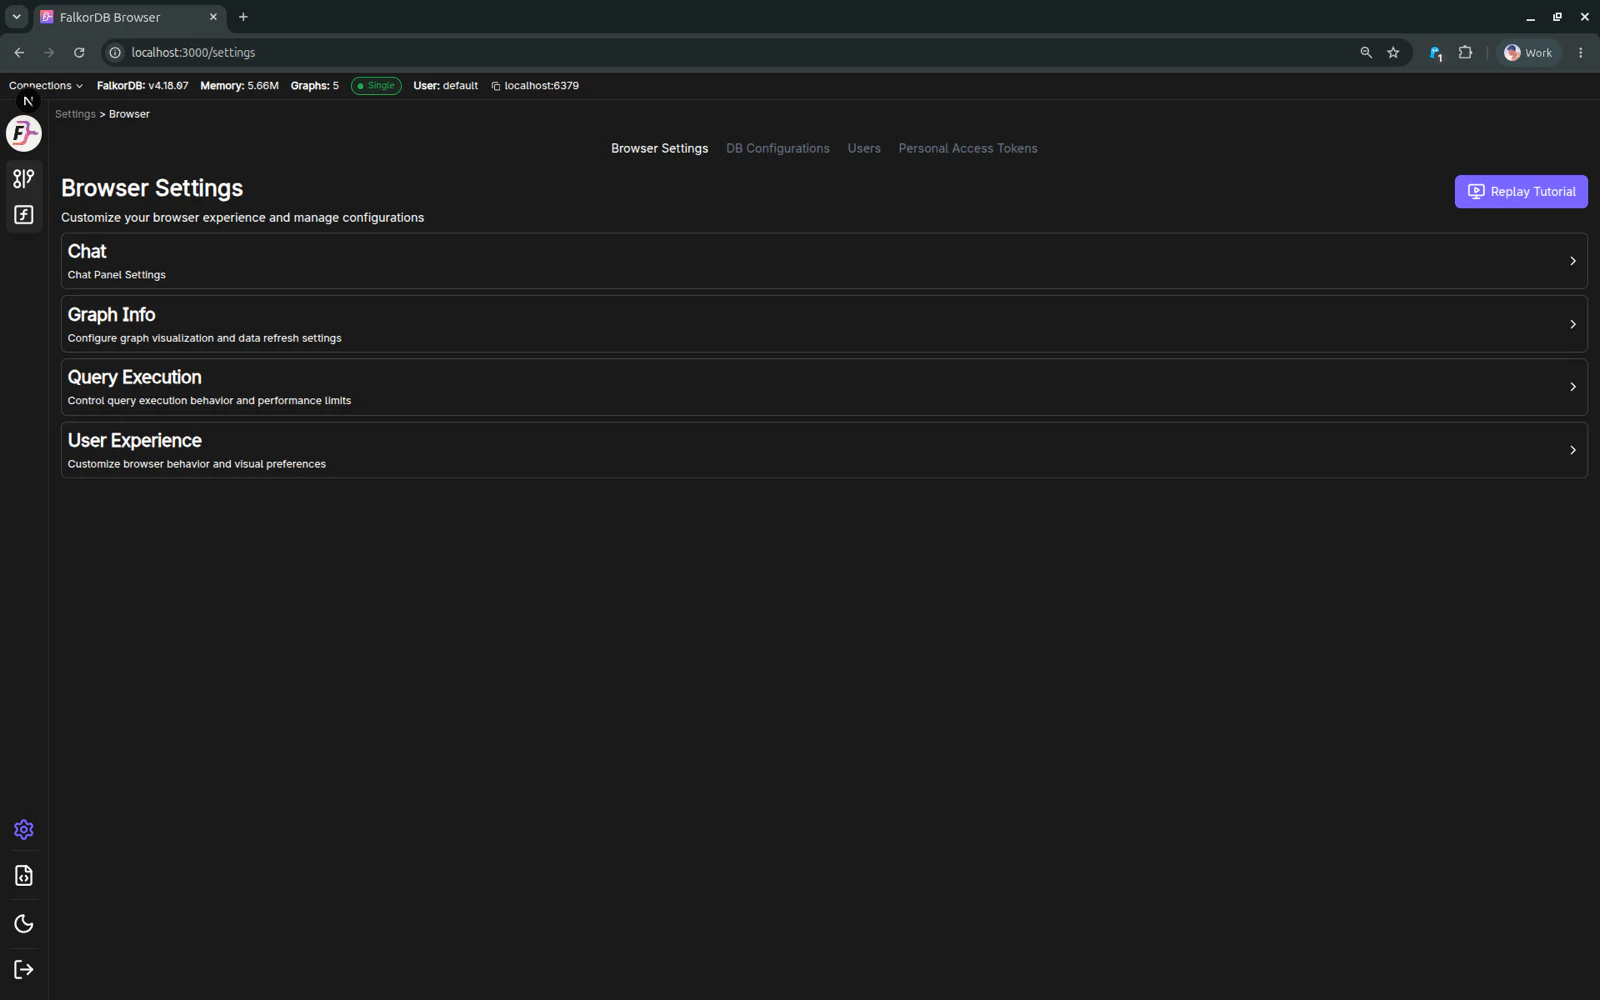
- Settings page
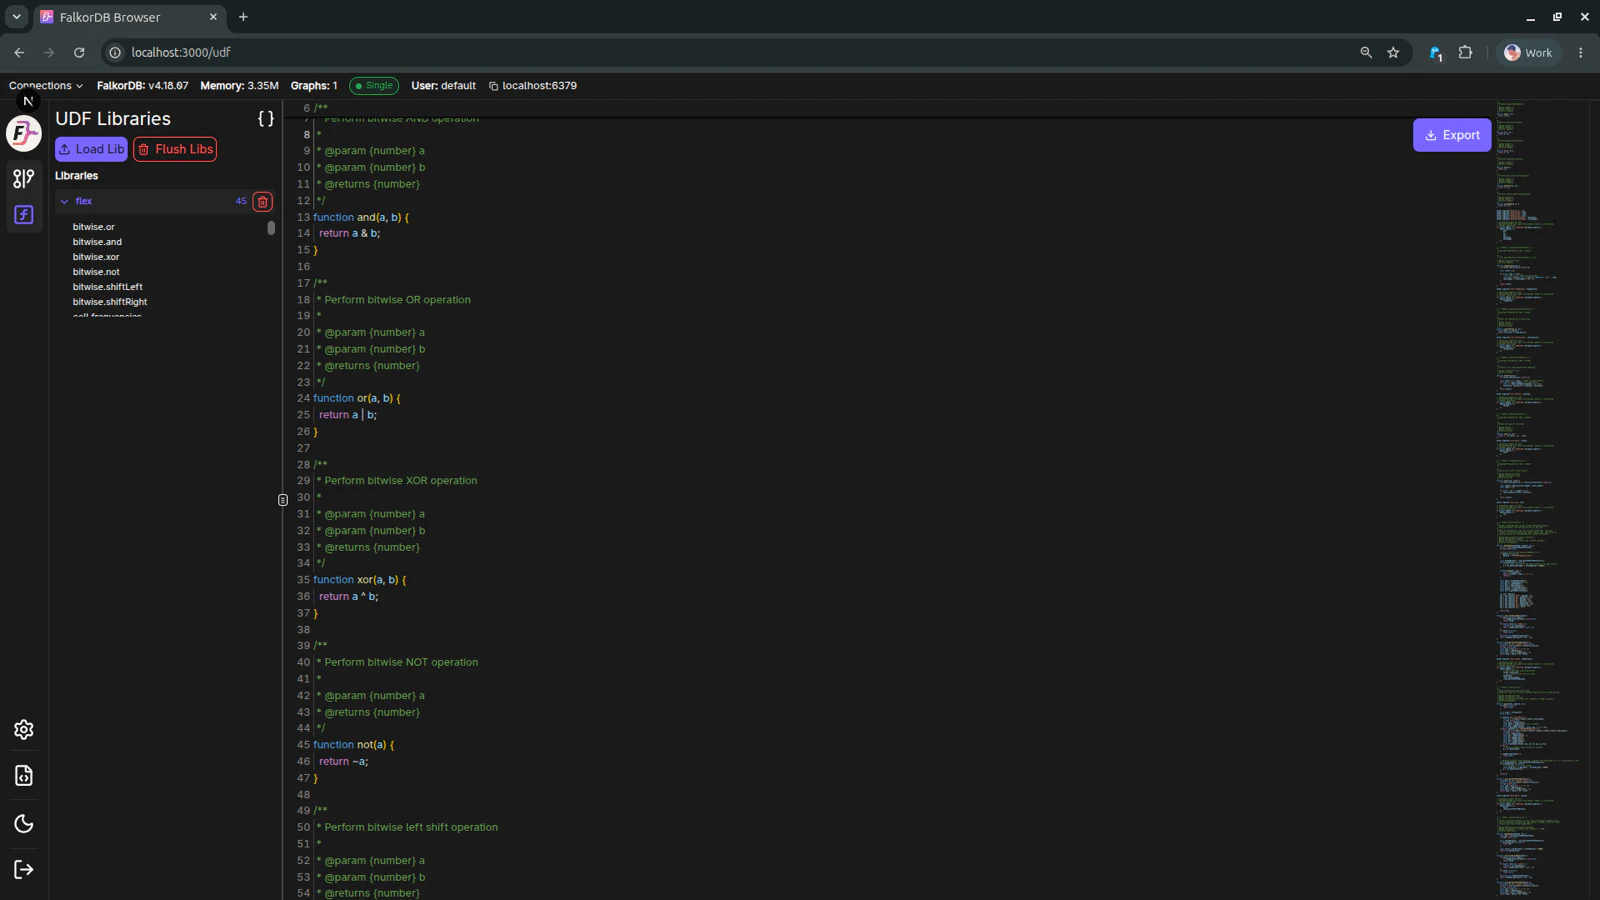
- UDF Libraries page


Authentication
Navigation & global controls
Settings
UDF management
Graph workspace
- Graph page (overall layout)
- Graph tabs
- Main graph canvas
- Graph Info panel
- Customize Style panel
- Data / Property panel
- Graph toolbar & element actions
- Graphs Manager
- Chat panel (natural-language to Cypher)
Querying & results
- Query editor
- Query history
- Upload Data dialog
- Table view
- Metadata view (Explain/Profile/Metadata)
- Schema view (labels, relationships, constraints, indexes)
Developer tooling
Frequently Asked Questions
What are the main sections of the FalkorDB Browser UI?
What are the main sections of the FalkorDB Browser UI?
The UI is organized into Authentication (login), Navigation & global controls, Settings, Graph workspace (canvas, panels, toolbar, chat), Querying & results (editor, history, table, metadata), and Developer tooling (API Docs).
Where do I find graph visualization controls?
Where do I find graph visualization controls?
Graph visualization controls are on the Graph page. See the Main graph canvas and Graph toolbar pages for details on pan/zoom, selection, and element actions.
How do I customize the appearance of nodes?
How do I customize the appearance of nodes?
Use the Customize Style panel to change colors and sizes per node label or relationship type. Open it from the Graph Info panel by clicking the palette icon next to a label or type.
Where can I see my graph's data model?
Where can I see my graph's data model?
Open the Schema tab in the results area. See Schema view for labels, relationship placements, property keys and types, constraints, and indexes.