

How it works
The Admin UI sends each query to the Admin Server, which runs it with the deployment’s default account and returns the result. You never handle the deployment’s password, and the Admin UI’s roles decide who may query what.- Routing. The Admin Server connects to the deployment from inside the Kubernetes cluster. On a sharded deployment, each query goes to the shard that owns the graph. With Sentinel, the Admin Server looks up the current primary for each request and connects to it directly. A request made during a failover can fail; run it again once the new primary is up.
- Connections. Each request opens its own connection and closes it when the reply arrives.
- TLS. When the deployment uses TLS, the connection does too. The server certificate is always checked: against the deployment’s CA when it has one, otherwise against the Admin Server’s system trust store, so a connection to a certificate neither trusts fails rather than sending the password. Its host name is not checked, because shards are reached at the addresses they announce, which the certificate doesn’t list.
Run a query
1
Open the console
Open the deployment in the Admin UI and click Query. The tab only appears for roles with the
read action on clusters.query.2
Pick a graph
The Graph field suggests the graphs in the deployment. You can also type the name of one that doesn’t exist yet, to create it with a write query.
3
Run the query
Enter the Cypher and click Run, or press Ctrl+Enter (⌘+Enter on macOS). Queries run read-only unless you turn on Allow writes.
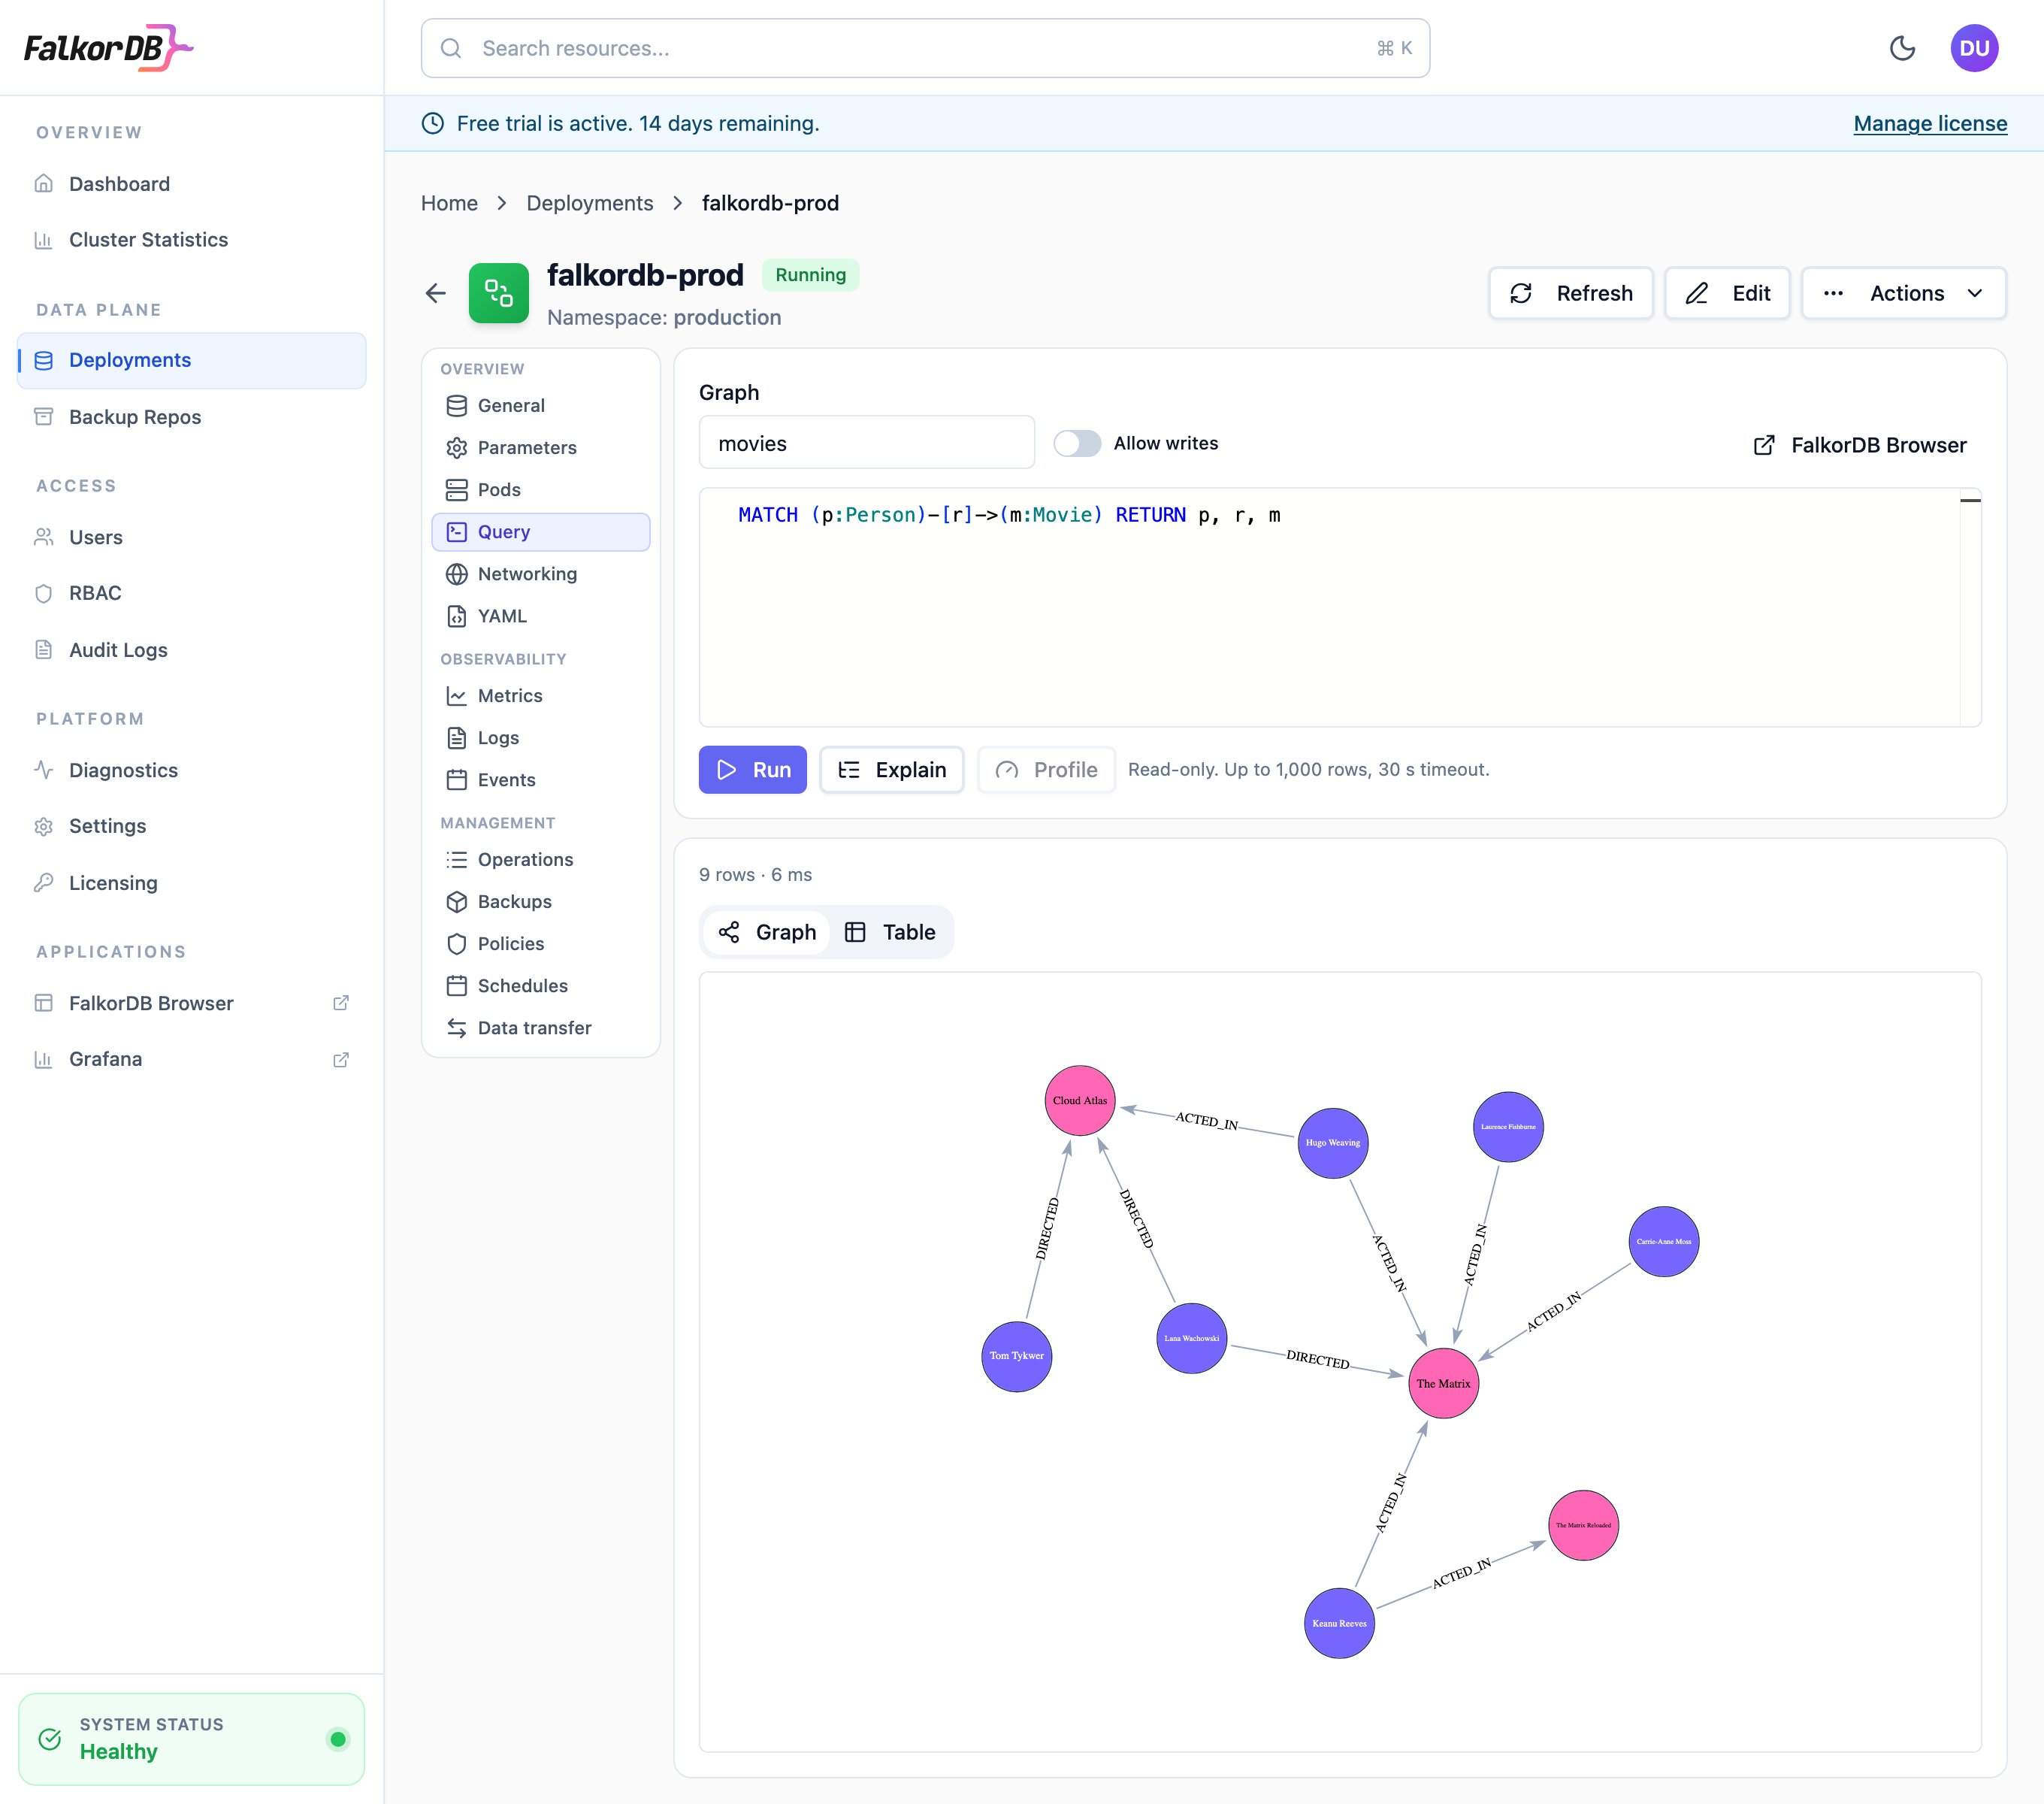
A query that returns people and the movies they acted in or directed, shown as a graph.
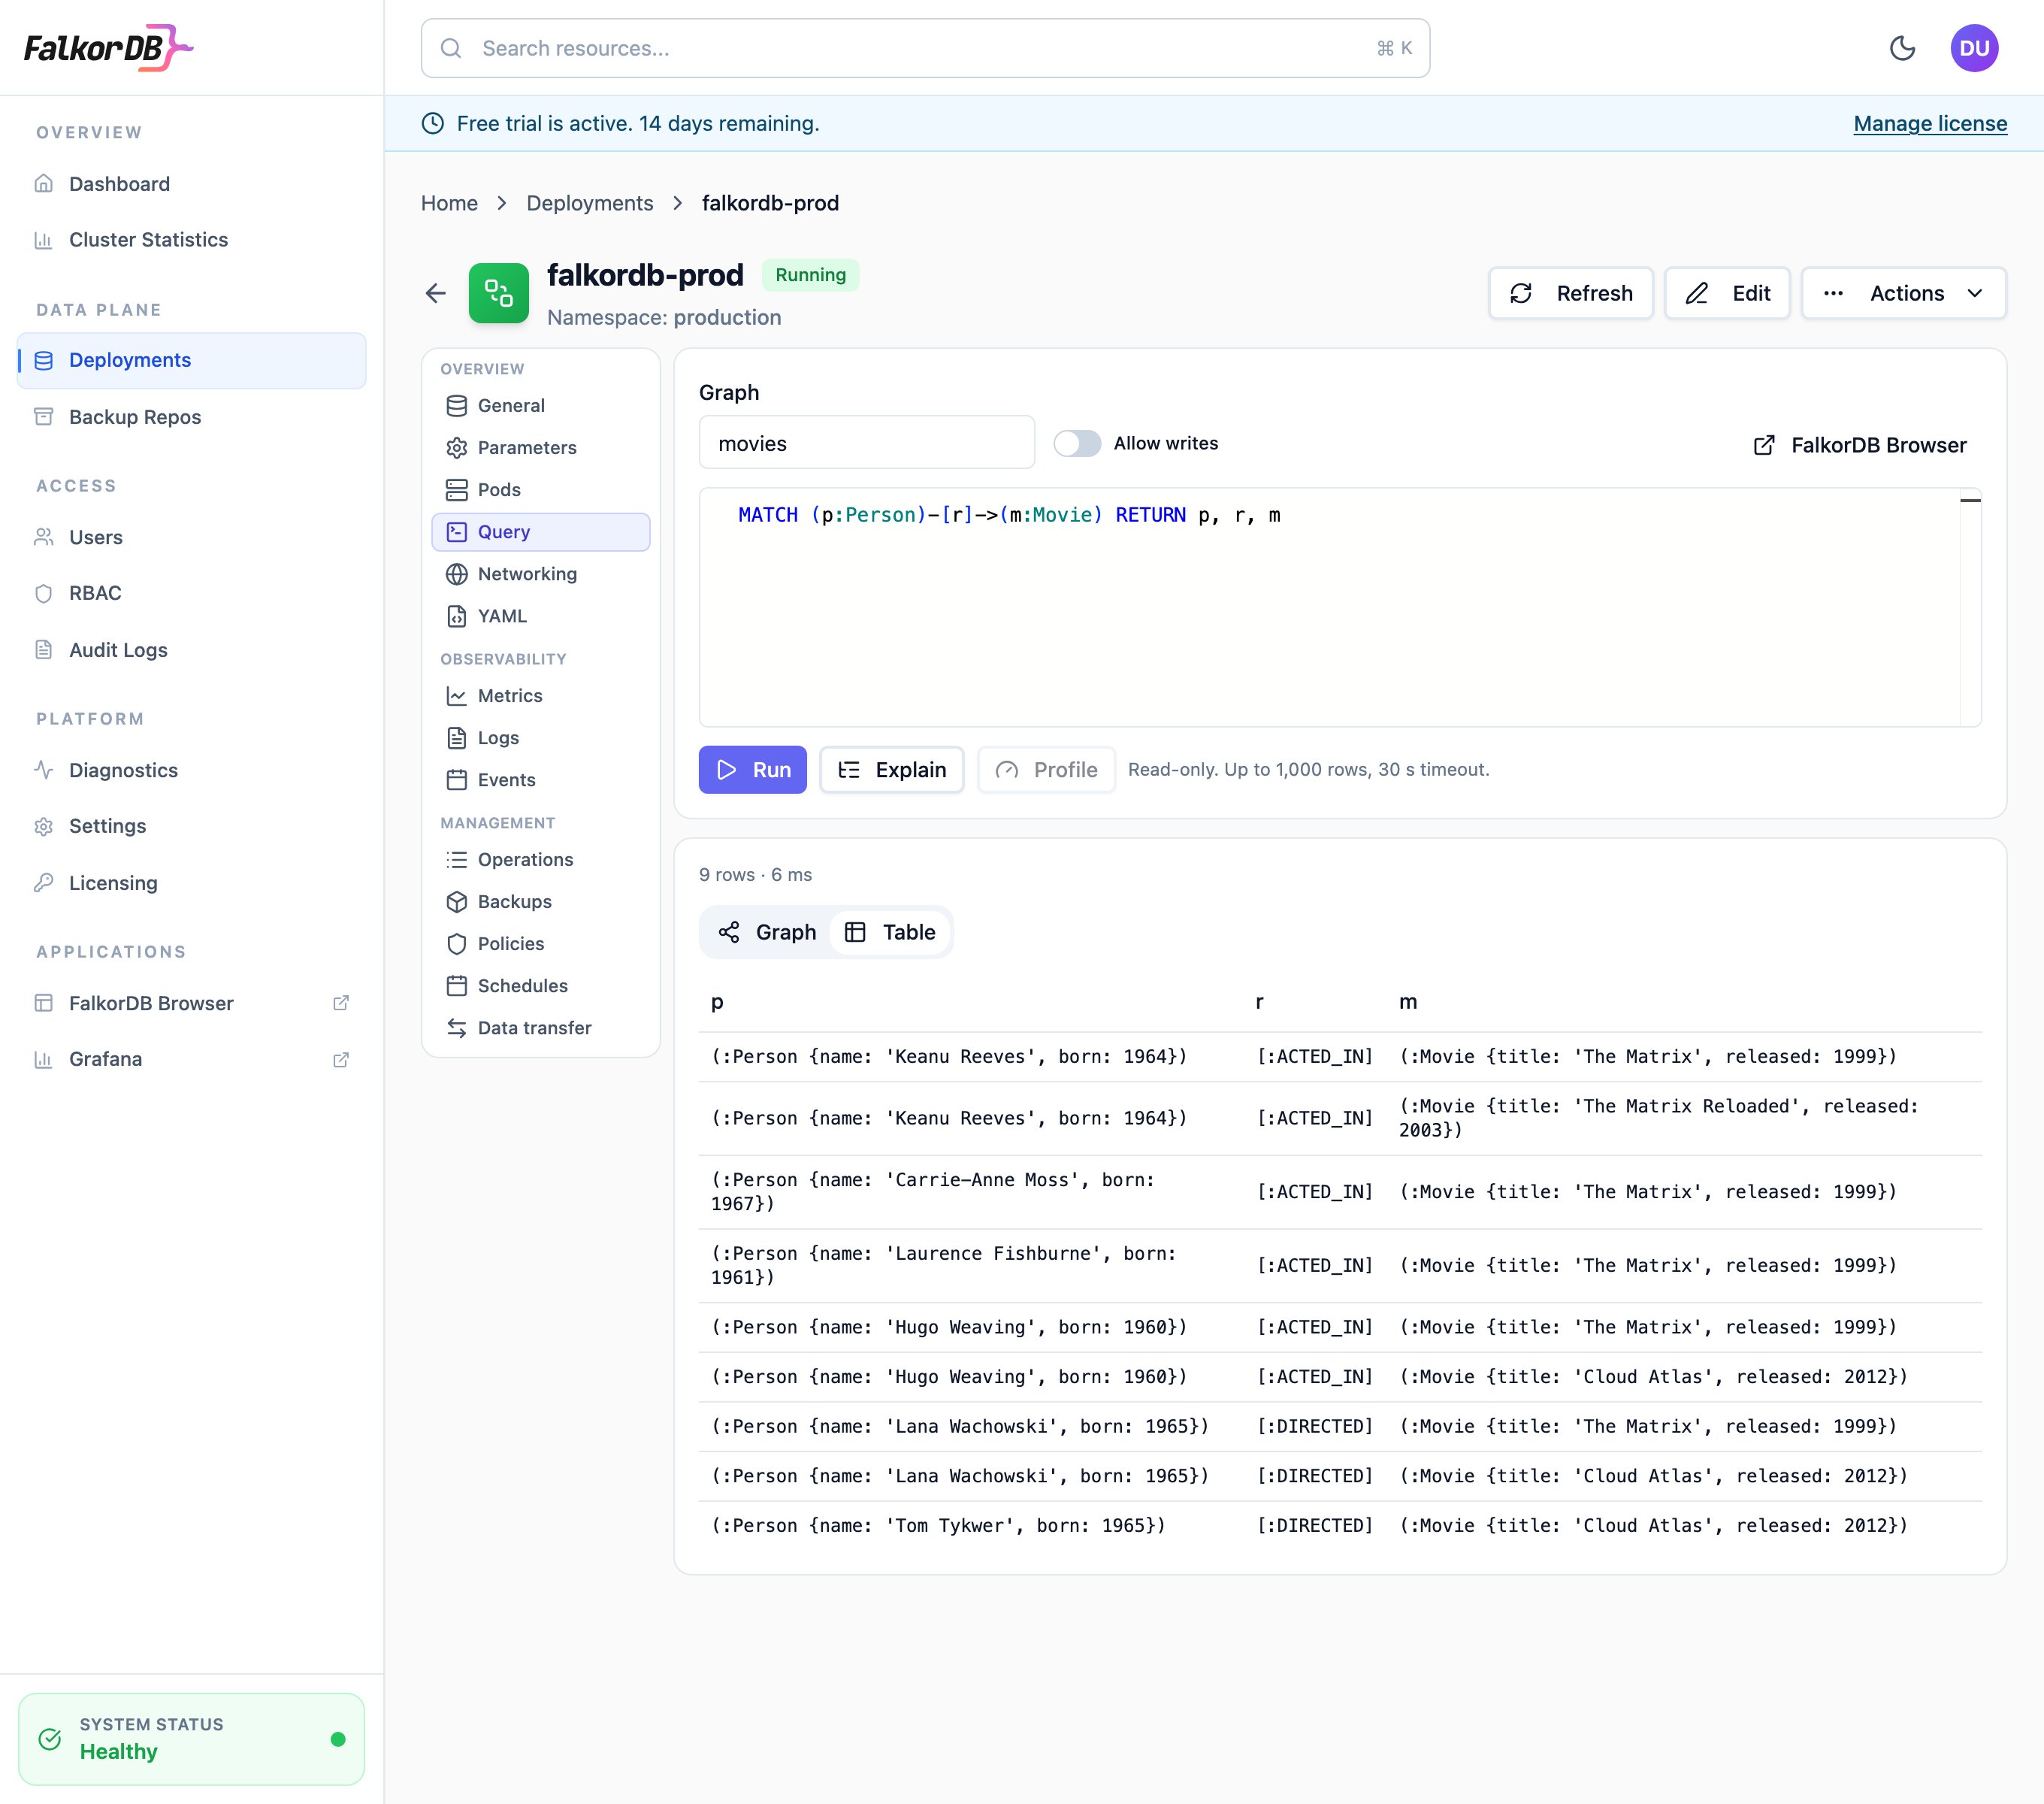
The same result as a table, with nodes and relationships written as Cypher patterns.
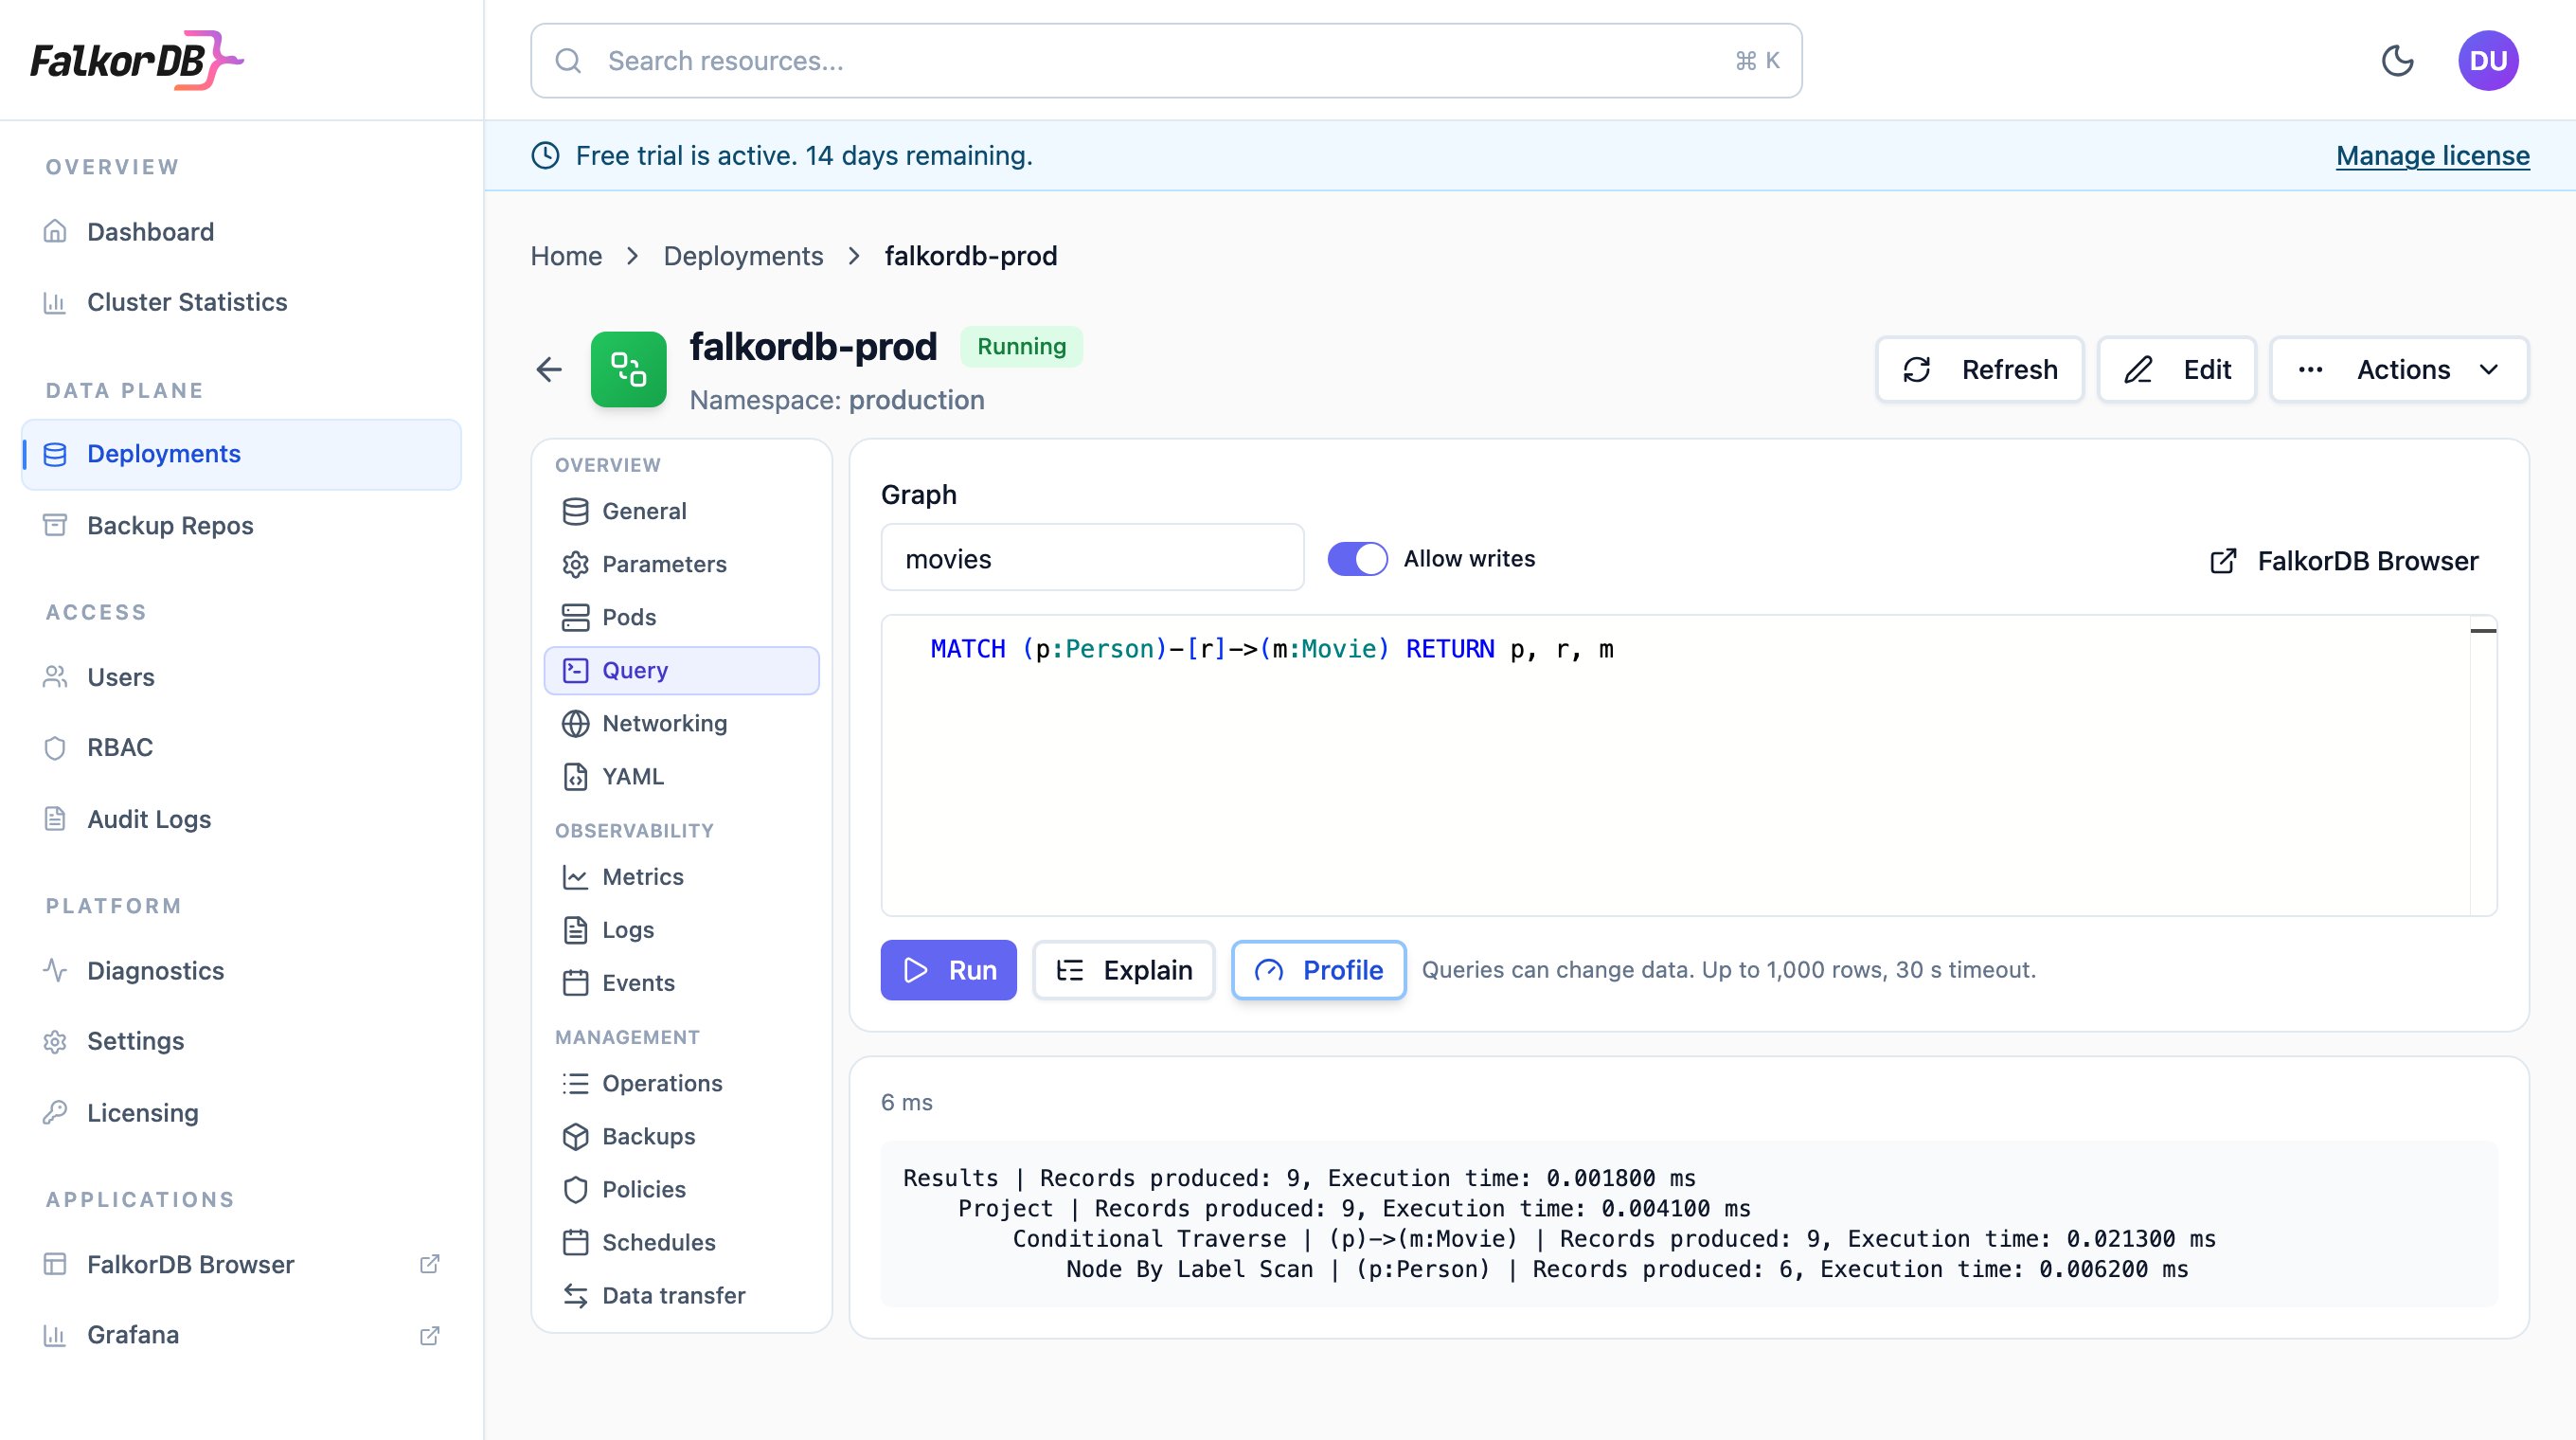
Profile shows each operation of the plan with the records it produced and the time it took.
Autocomplete and syntax checking
The editor uses the same Cypher engine as FalkorDB Browser. As you type, it suggests the keywords, functions, and procedures that fit where the cursor is, and the selected graph’s labels, relationship types, and property keys. Press Ctrl+Space to open the suggestions yourself.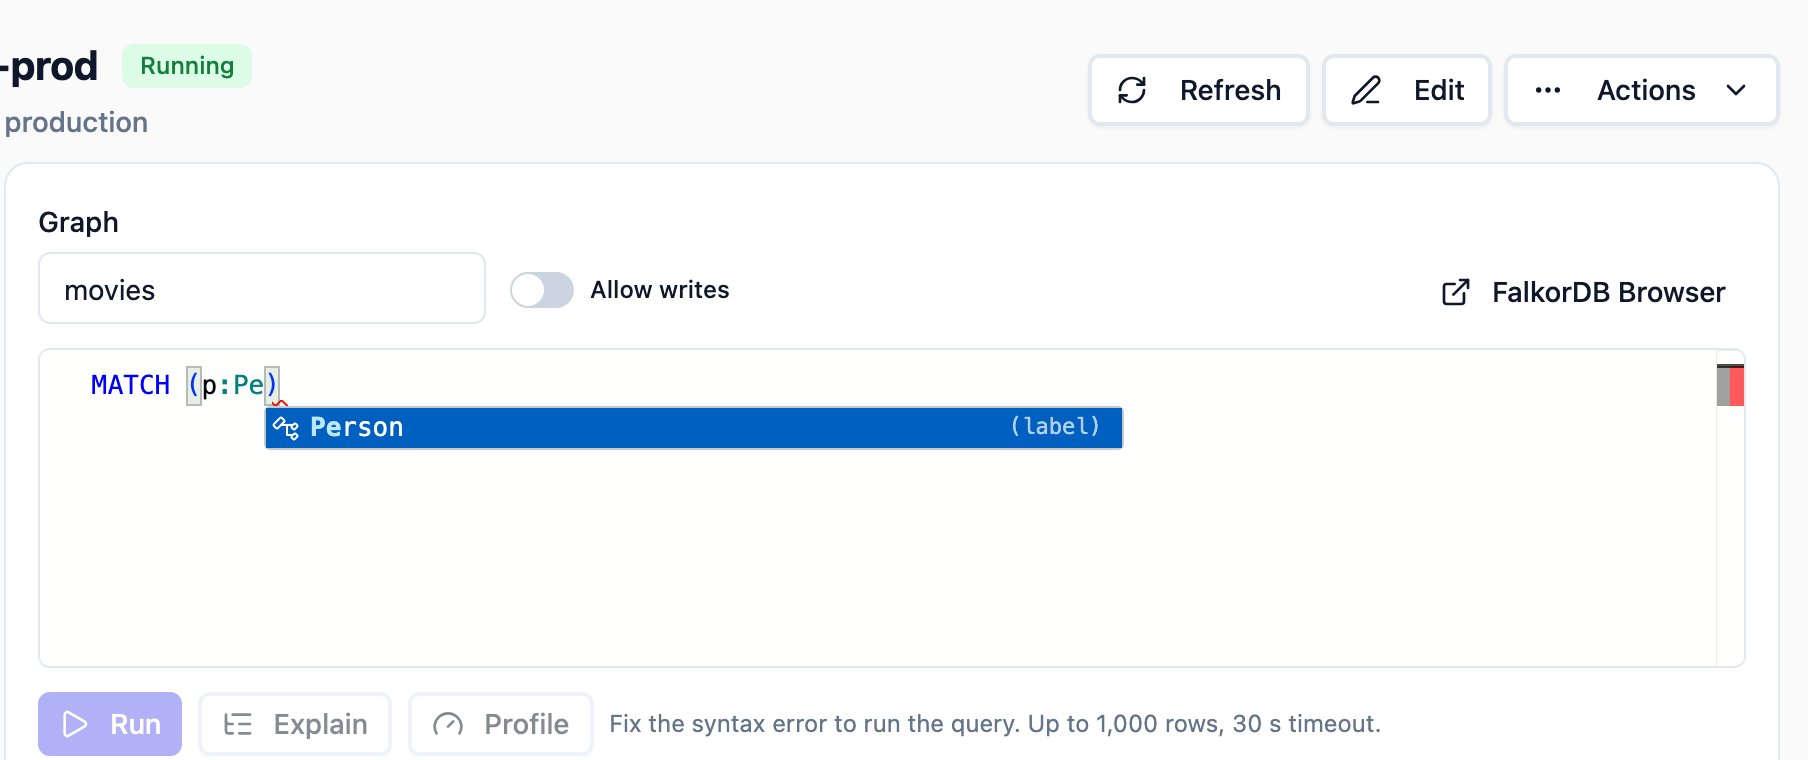
Suggestions come from the selected graph: here, its Person label.
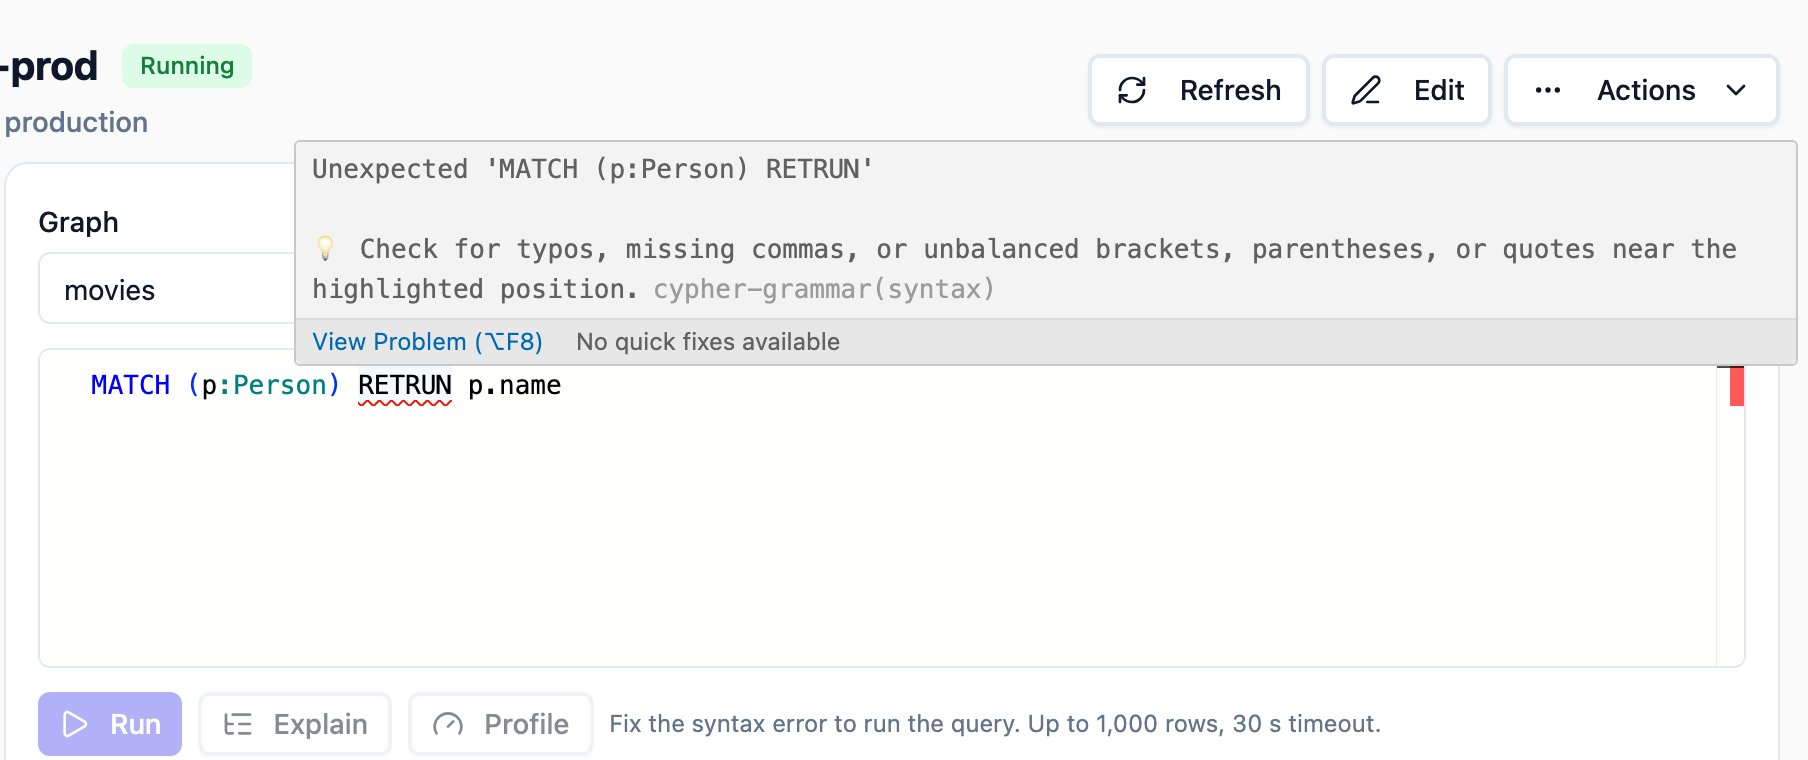
A misspelled RETURN is underlined, and the console won't run the query until it is fixed.
Limits
Each query, Profile included, runs with a timeout, passed to FalkorDB asTIMEOUT, and returns at most a fixed number of rows to the browser. When a result has more rows, the console says so; add a LIMIT or use FalkorDB Browser. The Admin Server still receives the full result before it drops the extra rows, so the timeout is what protects the database.
When the license has expired or is invalid, the console can still run read-only queries and Explain. Write queries and Profile are refused, like other changes.
Permissions
The console uses theclusters.query resource:
Rules can be scoped to a namespace like any other rule. The predefined admin and operator roles have both actions. The viewer role has neither, because query results show the data itself.
Audit log
Every query, Explain, and Profile is recorded in the audit log ascluster.query.execute, cluster.query.explain, or cluster.query.profile. The entry names the user, the deployment, and the graph, whether the query ran read-only, how many rows it returned, and how long it took. A failed query records only the kind of failure (rejected, not_found, unavailable, timeout, or internal), because database errors can quote the query; the full error is shown only to the user who ran it.
The entry holds a SHA-256 hash of the query and its length, not its text, and never the results. Literals in a query can carry the same data as its results; the hash still lets you match an entry to a query you have.
Network policy
WithnetworkPolicy.enabled, the chart lets the Admin Server reach database pods on 6379 and 26379 in every namespace while the console is enabled. Set adminServer.queryConsole.enabled=false to drop that rule. See Network policies.