> ## Documentation Index
> Fetch the complete documentation index at: https://docs.falkordb.com/llms.txt
> Use this file to discover all available pages before exploring further.
> ## Agent Instructions
> FalkorDB is a graph database that speaks the Redis protocol. Queries are issued as OpenCypher through the GRAPH.QUERY and GRAPH.RO_QUERY commands, not over Bolt or a SQL connection.
> FalkorDB implements a subset of OpenCypher with proprietary extensions. Do not assume Neo4j-only syntax or procedures are available — check /cypher/cypher-support and /cypher/known-limitations before using a clause.
> FalkorDB is the successor to RedisGraph, but they are separate products. Do not present RedisGraph commands, versions, or limitations as current FalkorDB behavior.
> Use the official clients listed in /getting-started/clients rather than generic Redis or Neo4j drivers, and prefer the language the user is already working in.
> Configuration parameters are set with GRAPH.CONFIG SET or at startup; cite the exact parameter name from /getting-started/configuration rather than inventing one.
> This site covers four products: FalkorDB (core), FalkorDB Cloud, FalkorDB Enterprise, and the GraphRAG SDK. Name which one an answer applies to, since setup and operations differ.
# Graph Page (Layout)
> How the main Graphs workspace is laid out: selector bar, query editor, results area, side panel that can be resized.
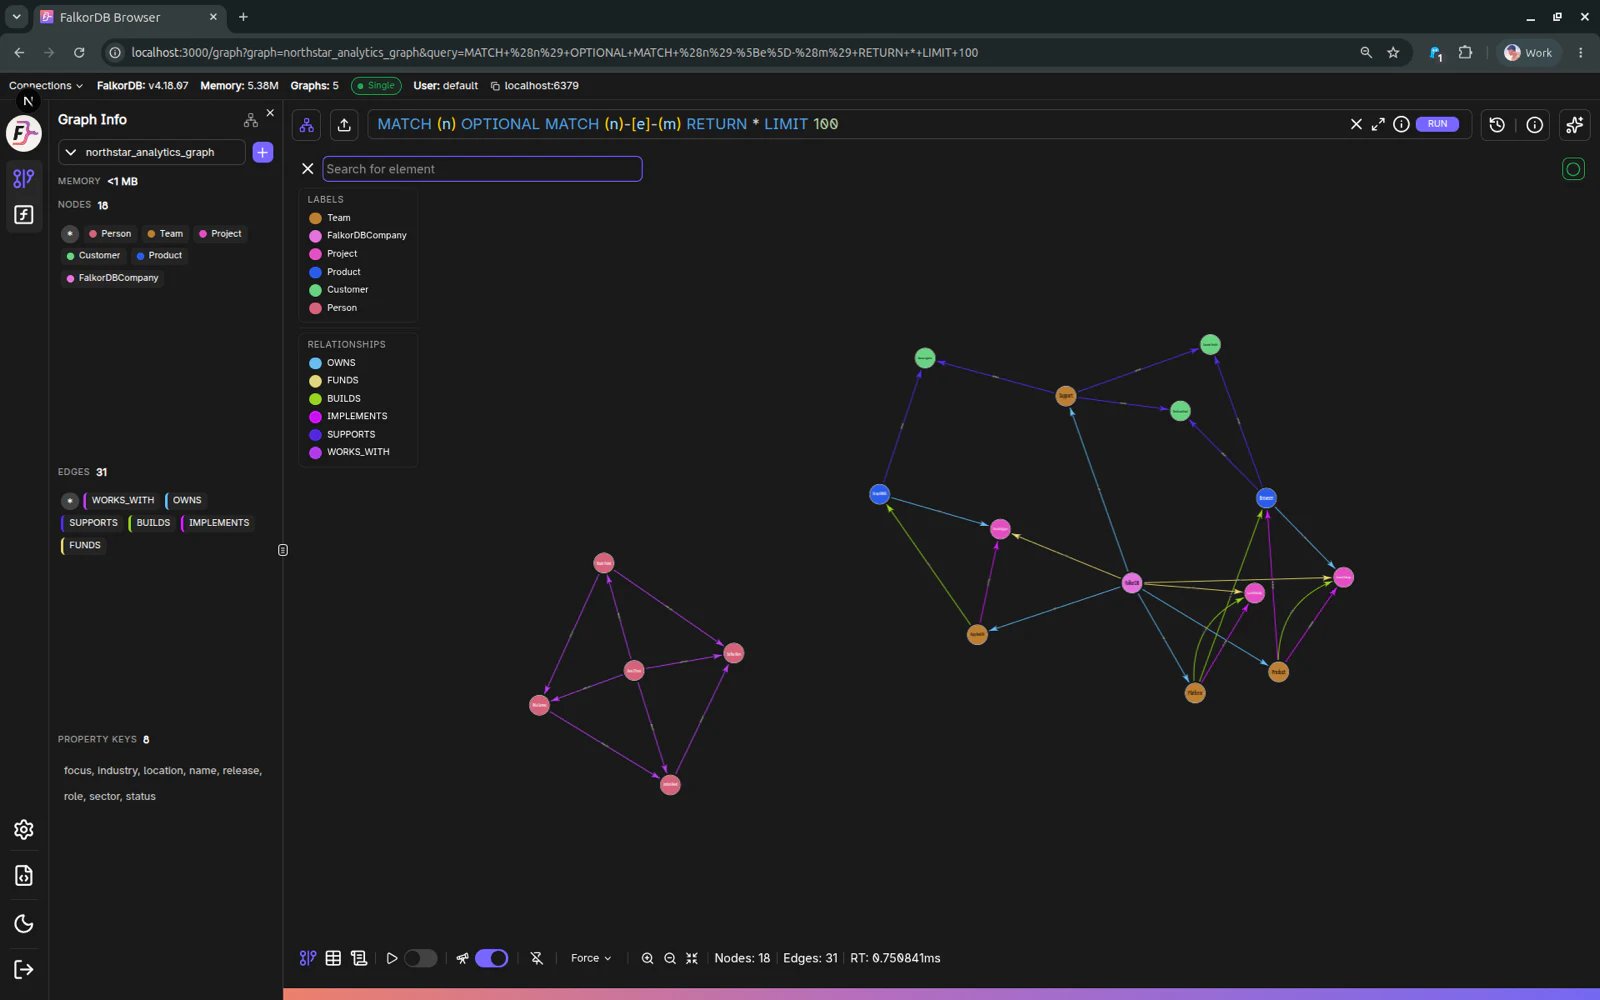
The Graph page (`/graph`) is the primary workspace for querying and visualizing data.
 ## High-level layout
The page is composed of:
1. **Left sidebar** (navigation, theme, graph info/chat toggles)
2. **Top selector bar**
* Graph selector (choose the active graph)
* Query editor (Monaco-based) with Run button
* Query history button + editor maximize button
3. **Main results area**
* **Graph** tab (visual canvas)
* **Table** tab (tabular results)
* **Metadata** tab (Explain/Profile/Metadata)
4. **Right side panel** (can be resized, context-driven)
* **Data panel** (inspect/edit selected node/edge)
* **Add panel** (create nodes/edges)
* **Chat panel** (natural-language querying)
## Right-hand panel resize behavior
The right panel expands/collapses based on what you’re doing:
* Selecting a node/edge typically opens **Data**.
* Starting “Add node / Add edge” opens **Add**.
* Toggling Chat opens **Chat** and clears selection.
## Graph info refresh
Graph info (labels, relationship types, property keys, memory usage) is periodically refreshed based on the configured refresh interval.
## Frequently Asked Questions
The page has a **left sidebar** for navigation, a **top selector bar** with the graph selector and query editor, a **main results area** with Graph/Table/Metadata tabs, and a **right side panel** for data inspection, adding elements, or chat.
Yes. The right panel expands and collapses based on context (selecting an element opens Data, creating elements opens Add, toggling Chat opens the Chat panel) and can be manually resized.
Graph Info refreshes periodically based on the **refresh interval** configured in Settings → Browser Settings → Graph Info.
The three tabs are **Graph** (visual canvas), **Table** (tabular rows/columns), and **Metadata** (Explain/Profile/Metadata output).
## High-level layout
The page is composed of:
1. **Left sidebar** (navigation, theme, graph info/chat toggles)
2. **Top selector bar**
* Graph selector (choose the active graph)
* Query editor (Monaco-based) with Run button
* Query history button + editor maximize button
3. **Main results area**
* **Graph** tab (visual canvas)
* **Table** tab (tabular results)
* **Metadata** tab (Explain/Profile/Metadata)
4. **Right side panel** (can be resized, context-driven)
* **Data panel** (inspect/edit selected node/edge)
* **Add panel** (create nodes/edges)
* **Chat panel** (natural-language querying)
## Right-hand panel resize behavior
The right panel expands/collapses based on what you’re doing:
* Selecting a node/edge typically opens **Data**.
* Starting “Add node / Add edge” opens **Add**.
* Toggling Chat opens **Chat** and clears selection.
## Graph info refresh
Graph info (labels, relationship types, property keys, memory usage) is periodically refreshed based on the configured refresh interval.
## Frequently Asked Questions
The page has a **left sidebar** for navigation, a **top selector bar** with the graph selector and query editor, a **main results area** with Graph/Table/Metadata tabs, and a **right side panel** for data inspection, adding elements, or chat.
Yes. The right panel expands and collapses based on context (selecting an element opens Data, creating elements opens Add, toggling Chat opens the Chat panel) and can be manually resized.
Graph Info refreshes periodically based on the **refresh interval** configured in Settings → Browser Settings → Graph Info.
The three tabs are **Graph** (visual canvas), **Table** (tabular rows/columns), and **Metadata** (Explain/Profile/Metadata output).