> ## Documentation Index
> Fetch the complete documentation index at: https://docs.falkordb.com/llms.txt
> Use this file to discover all available pages before exploring further.
> ## Agent Instructions
> FalkorDB is a graph database that speaks the Redis protocol. Queries are issued as OpenCypher through the GRAPH.QUERY and GRAPH.RO_QUERY commands, not over Bolt or a SQL connection.
> FalkorDB implements a subset of OpenCypher with proprietary extensions. Do not assume Neo4j-only syntax or procedures are available — check /cypher/cypher-support and /cypher/known-limitations before using a clause.
> FalkorDB is the successor to RedisGraph, but they are separate products. Do not present RedisGraph commands, versions, or limitations as current FalkorDB behavior.
> Use the official clients listed in /getting-started/clients rather than generic Redis or Neo4j drivers, and prefer the language the user is already working in.
> Configuration parameters are set with GRAPH.CONFIG SET or at startup; cite the exact parameter name from /getting-started/configuration rather than inventing one.
> This site covers four products: FalkorDB (core), FalkorDB Cloud, FalkorDB Enterprise, and the GraphRAG SDK. Name which one an answer applies to, since setup and operations differ.
# Main Graph Canvas
> Interactive graph visualization: pan/zoom, selection, label/relationship toggles, and layout controls.
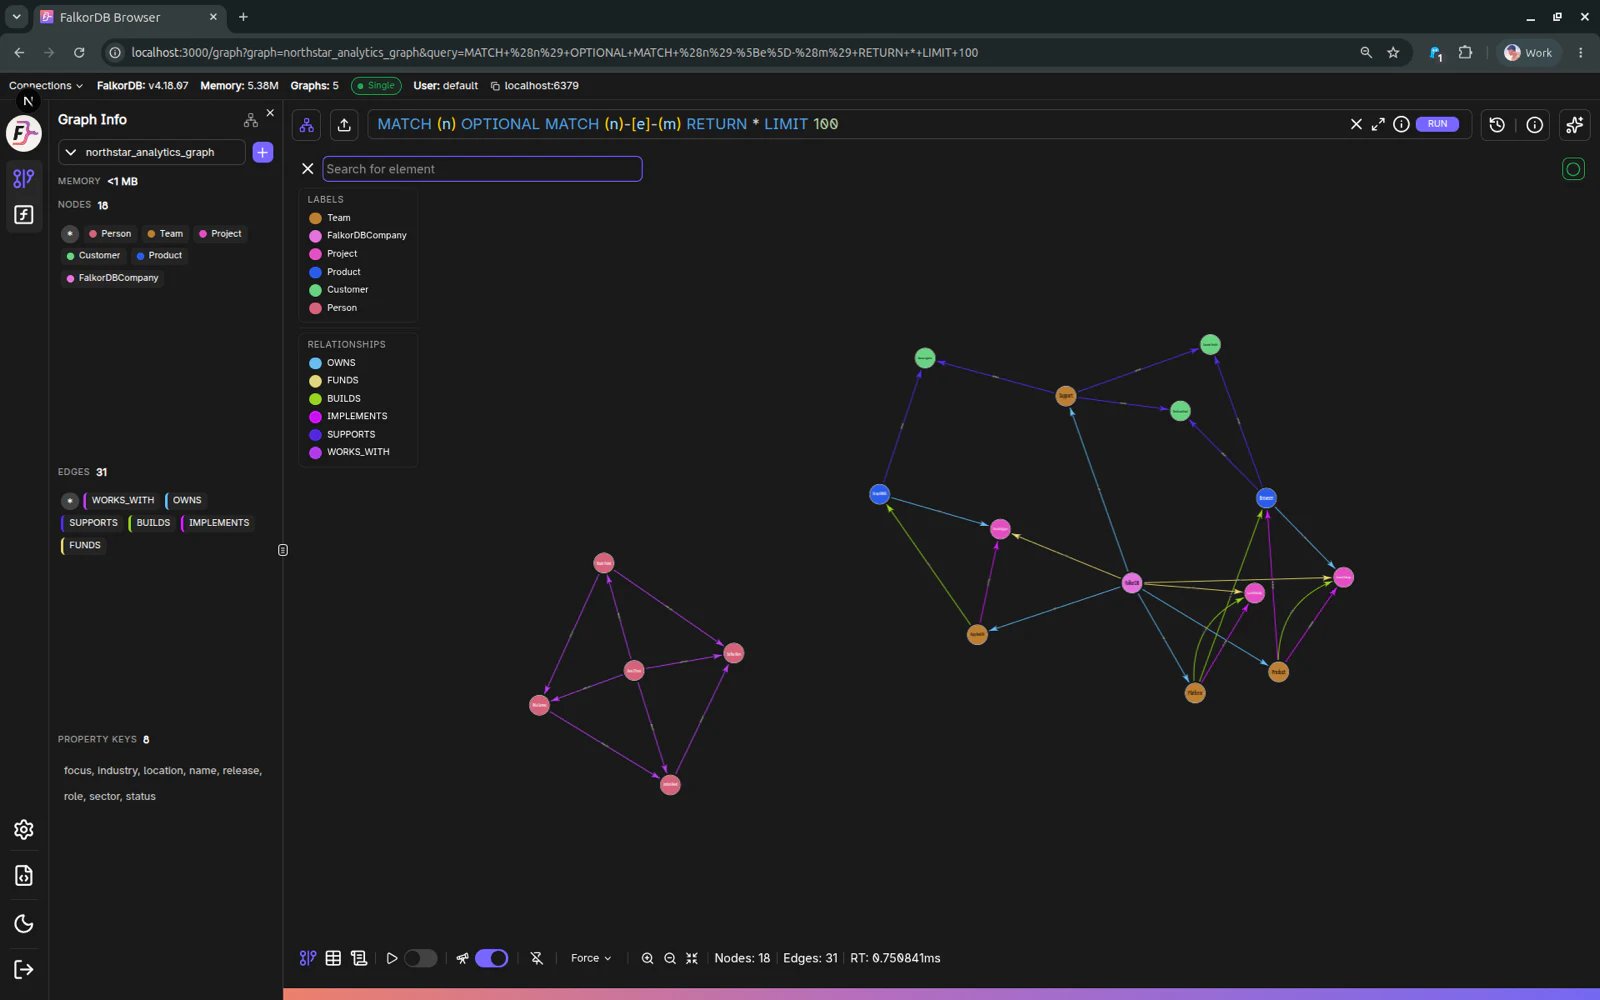
The **Graph** results tab renders your query results as an interactive node/edge visualization.
 ## Core interactions
* **Pan/zoom** the canvas to explore results.
* **Select** nodes/edges to inspect them (opens the Data panel).
* **Right-click / context menu** is used in the tutorial flow to open element details.
## Labels & Relationships filters
When you have results, the overlay includes:
* **Labels** list: toggle visibility of nodes by label.
* **Relationships** list: toggle visibility of edges by relationship type.
These toggles update visibility on the canvas without re-running the query.
## Canvas controls
The controls area includes:
* **Animation control** (play/pause force-layout delay)
* **Zoom in / Zoom out**
* **Center / fit to screen**
## Tabs around the canvas
From the same results region you can switch to:
* **Table** view (when tabular data exists)
* **Metadata** view (when metadata/explain exists)
## Frequently Asked Questions
Use your mouse or trackpad to **pan** (click and drag the background) and **zoom** (scroll wheel or pinch gesture). You can also use the zoom in/out buttons in the canvas controls.
Yes. Use the **Labels** and **Relationships** filter lists overlaid on the canvas to toggle visibility of specific node labels or edge types without re-running the query.
Click the **Center / fit to screen** button in the canvas controls area to automatically fit all visible elements within the viewport.
The play/pause button controls the **force-layout animation** which arranges nodes dynamically. Pausing it freezes the layout in its current position.
## Core interactions
* **Pan/zoom** the canvas to explore results.
* **Select** nodes/edges to inspect them (opens the Data panel).
* **Right-click / context menu** is used in the tutorial flow to open element details.
## Labels & Relationships filters
When you have results, the overlay includes:
* **Labels** list: toggle visibility of nodes by label.
* **Relationships** list: toggle visibility of edges by relationship type.
These toggles update visibility on the canvas without re-running the query.
## Canvas controls
The controls area includes:
* **Animation control** (play/pause force-layout delay)
* **Zoom in / Zoom out**
* **Center / fit to screen**
## Tabs around the canvas
From the same results region you can switch to:
* **Table** view (when tabular data exists)
* **Metadata** view (when metadata/explain exists)
## Frequently Asked Questions
Use your mouse or trackpad to **pan** (click and drag the background) and **zoom** (scroll wheel or pinch gesture). You can also use the zoom in/out buttons in the canvas controls.
Yes. Use the **Labels** and **Relationships** filter lists overlaid on the canvas to toggle visibility of specific node labels or edge types without re-running the query.
Click the **Center / fit to screen** button in the canvas controls area to automatically fit all visible elements within the viewport.
The play/pause button controls the **force-layout animation** which arranges nodes dynamically. Pausing it freezes the layout in its current position.